When you get congratualations from your broker (indirectly)
I use CortalConsors as my broker for the non-German part of my portfolio, especially as they don’t charge any extra fees for French stocks. Some months ago, they started to send out performance and risk reports with some more or less usefull stuff on it.
One interesting feature is a return/standard deviation graph comparing the portfolio against several benchmarks. I was really surprised how well the portfolio is doing:
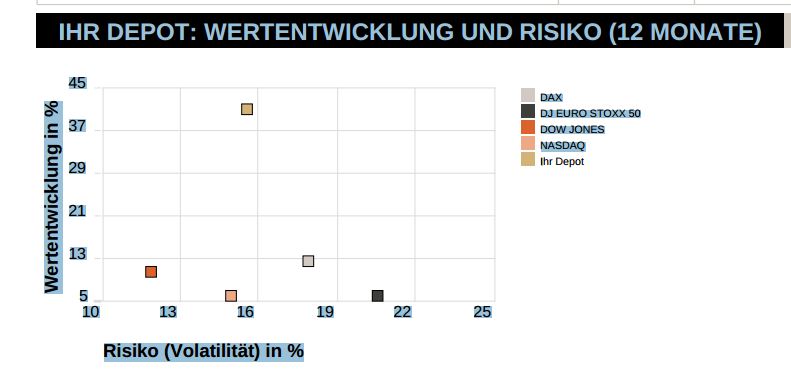
Explanation: The vertical axis is the return in the last 12 months (until end of March 2013), the horizontal one is the volatility meassured as standard deviation. The portfolio is (of course) the lonely light orange dot in the upper part of the chart….
Clearly, this will not go on like this forever. Nevertheless, I think it also shows that value investing is not dead yet, at least for the little guys 😉
If I would do this professionally, now would be the time to make a big advertising effort …….. It doens’t get much better than that.

Cool and congrats!
Mario A. Rodríguez