What if you could team up with similar Brazilian guys like good old Warren did ? In theory, there is a good chance by buying shares in GP Investments, a listed Brazilian Private Equity company. GP Investments is not any Brazilian Private Equity company, but was the original Private Equity vehicle of “genius” investor Jorge Paolo Lemann. He sold the company in 2003 to his Junior partners and then went on to found 3G.
So in theory, GP Investments is like the “Junior” version of 3G with a LatAm focus and some of the employees of GP have actually been hired by the 3G guys which are all bilionaires now (Lemann is according to Bloomberg now number 28 in the world with a net worth of 24,8 bn USD).
GP investments trades at a discount to its holdings (in which it invests along its 3rd party private equity funds) plus you get the asset management company for free. On top of that, management is aligned with shareholders and repurchases shares.
Further, two “gold standard” value investment firms have large positions, Third Avenue with 11,65% and “legendary” Sequoia with 11,8%. Finally, GP Investments announced two very succesful exits over the last weeks which made them good money (BR Towers and SASCAR).
The stock price increased a little bit since then, but still, the stock looks very much undervalued and almost a “No brainer” if one is looking for a Brazilian investment opportunity.
What is the asset management business worth ?
My answer: Not much. Look at this table:
Management Fees
Salaries, expenses
Bonuses
Net
2006
15.5
-18.99
-5.2
-8.69
2007
26.2
-38.1
-9.2
-21.1
2008
13.9
-47.9
-3.9
-37.9
2009
16.2
-47.9
-13.4
-45.1
2010
25.0
-48.6
-15.3
-38.9
2011
17.4
-45.4
-7.7
-35.7
2012
22.4
-60.2
-19.3
-57.1
2013
20.5
-74.9
-8.4
-62.8
Total
157.1
-382.0
-82.4
-307.3
Based on the available US GAAP account I created this table showing the assets maganagement fees charged to third party investors against salaries, expenses and bonuses for GP’s employes and operation. We can easily see that the balance has been increasingly negative over the years. Since the IPO, the “Asset Management Business” has cost the shareholders some serious money. Even if we assume that expenses include other general expenses, then to me the value of the Asset Manegement looks rather negative, it looks like that GP shareholders are subsidising 3rd party investors to a significant extent.
Private Equity track record
If you read through GP’s investor presentation, they always stress their great track record since 1993 with a lot of examples of exits where they made a lot of money. However, we never find a “real” track record which shows the real IRR for all assets. For an Asset Manager, the track record is the most important asset, before anything else.
In the following table, I tried to recreate their PE track record based on their published numbers since their IPO 2006 (in USD). I used disclosed US GAAP numbers and then calculated a simplified annual IRR. One remark: Minorities are a big contributor in GP’s P&L. I assumed that all minority results are PE related. In the table, a positive number in the column minorities means that the loss has been shared with minorities and vice versa for profits.
Investments eoy
Realized gains, Div
increase in value
Minorities
Total return
in % a.m.
2006
173.9
2007
1165
59.2
279.8
-169.0
170.0
25.39%
2008
1381
11.8
-513.9
304.2
-197.9
-15.55%
2009
1568
229.0
241.5
-284.0
186.5
12.65%
2010
1431
-47.8
-39.0
68.2
-18.6
-1.24%
2011
1173
38.3
-348.0
236.0
-73.7
-5.66%
2012
1279
133.0
-120.3
44.0
56.7
4.62%
2013
998.3
-284.2
191.6
89.6
-3.0
-0.26%
Total
139.3
-308.3
289.0
120.0
It’s not hard to see that the Performance only looks good the first year, after the they went public.Since then, the track record has been very weak. The Bovespa made in the same period a total return in USD of ~0,7% p.a. So yes, they performed slightly better than the Bovespa, but after bonsues and expenses, GP shareholders would have been better off with an index fund. Bad timing plays clearly a certain role here as well, however on the other hand it is hard to understand how the justify paying out more than 80 mn USD in bonuses for such a mediocre perfomance.
A few additional remarks on that from my side:
Debt/leverage
After the IPO, GP took on leverage, both as a bank loan and with an issuance of a perpetual note. Especially the perptual note in USD with 10% might have looked as a good idea when interest rates in Brazil were high and the real gained against the dollar, but now, with the real loosing significantly, this currency bet is of course making things worse. Additionally shareholders have additionally lost money via a “negative carry” on the debt funding compared to their low single digit investment returns.
Stock options / Alignment of interest
Since 2006, more than 50 mn options have been granted to the employees (against around 160 mn shares). Some are pretty far out of the money, but still, combined with the bonuses it doesn’t look like that there is “full alignment” between shareholders and employees. The executed share repurchases look rather small compared to the option grants.
“Diworsification”
In the last few years, GP diversified into infrastructure and real estate. For me, this is a clear sign that they focus on asset gathering rather than on performance. I think their problem is that they cannot raise a new PE fund as their perfomance is most likely substandard and many more competitors are now active in Brazil then when they started. Additionally, on of their recent pruchases, a Swiss based listed fund-of-fund vehicle called “APEN” s also not really consistent with their LatAm focused strategy.
So the big question is:
Is GP Investments a good investment despite the substandard track record ? Will they be able to generate better returns going forward ?
What I am concerned about is the fact that they seem to hang on their loosers and sell winners pretty quickly. Making 100% in 3 years sounds good, but the real money is made with investments that make 5 or 10 times their initial investment. Overall, to me it looks like that the bonuses which are paid independent of overall investment results are the biggest issue. In a “Good” private equity structure, the employees only cash out AFTER the full portfolio has been cashed out and the overall result. In my opinion, this is the only way how to align incentives in such an environment.
Finally, a few words on the “Lemann / 3G” connection: In the book “Dream Big”, which I just finished reading (review follows soon…) and which sketches the carreers of the 3G guys, Lemann is quoted that he left GP Investments because of 2 reasons:
1. GP did chase too many deals, as he wanted to focus only on a few for the very long term
2. He didn’t like the way his younger partners payed themselves big salaries. His credo was always that salaries and bonuses had to be fully reinvested into the company and employees should have a simple life style
So for me at this stage, I will not invest in GP. Despite the interesting and initially compelling story, I am simply not convinced that GP going forward will be a better investment than a Bovespa index fund. Full stop.
“Funny Money” is a rather “old” book, originally from 1984, covering the story of the Oklahoma Oil boom in the early 80ties and the subsequent bakruptcy of Penn Square Bank.
The most interesting thing about the book is that nothing is ever new in finance and history always repeats although not exactly but in similar fashion.
Penn Square Bank was a small Bank in Oklahoma City which was lending to local Oil and Gas companies. When a big well was found (the “Tomcat”), prices in that area exploded and a great boom started. Very similar to the real estate boom many years later, Penn Square was lending against market values, which in boom times looks always good.
Penn Square could do even more harm via “syndication”, in many cases they did pocket the arrangers fee but only kept 1% of the loan and “upstreamed” the other 99% to bigger banks. One of those banks, Continental Illinois, one of the largest commercial lenders in the US at that time went under 1 or 2 years after Penn Square and had to be bailed out by the US Government. Although the instrument is different, this is exactly what happened with all the CDO structures 25 years later in our socalled “Financial crisis”.
The book also offers a lot of insight into the Oil and Gas explorer industry which I think is still relevant today. MLPs for instance were very popular already back then, but as always, mostly only some of the promoters became rich.
Funnily, one of the most notourious promoters at that time, Robert A. Hefner IV, seems to be still around.
The author originally covered the events as a reporter for the “New Yorker” and then packaged the stories into a book. So its a pretty good “real time” description of a classic boom & bust cycle fulled by credit and credit derivatives. It is also proof that you don’t need to combine investment banks and commercial banks to screw up, commercial banks can do that on their own pretty well. Interestingly in the book, one senator gets quoted that “bank deregulation had gone too far” back then in the early 80ties. But this was a time what we would consider now as “tightly regulated”.
Another similarity to modern cases is the fact, that none of the “big guys” had to go to prison, only “lower level” guys got sentenced and one of them only because his employer needed to cash in the fraud insurance policy. Finally, the main players of the Oil Boom behaved very similar to Investment bankers in the 2000s and Internet entrepreneurs today. Private planes, helicopters, 1000 USD dinners etc. were already standard for the high rollers back then.
I think the main take-away from the book is that boom and busts will always occur and banks are inherently instable especially when there is a lot of credit growth. As an investor, it usually pays to stay out of such areas, unless you are very close to the promoters, otherwise the risk to get “fleeced” is very high.
Summary: I can highly recommend the book to anyone who is interested in the history of capital markets, especially boom and bust stories. This is one of the “classics”. As an add-on it gives some insight into the Oil and Gas explorer/drilling industry.
Disclosure: The author might have bought the stock well in advance of publishing the post. In this special case, the idea has been presented already some weeks ago to a group of value investors.
Introduction
Admiral is a UK based P&C insurance company. A brief look into Admiral’s multiples would single it out as a potential short candidate (~15 GBP/share):
P/B 8,0
P/S 4,5
P/E ~14,5
Div. yield 3,7%
Especially P/B and P/S look overvalued if compared to other P&C companies. The average multiple for European P&C companies is ~2,1 for P/B, 1,6 for P/S and 11,6 P/E. So the company looks wildly overvalued.
The pitch is relatively simple: Admiral is the UK version of GEICO, the famous low cost direct insurer owned by Warren Buffet. Just look at the cost ratios of Admiral compared to its 4 main competitors:
Cost ratio P&C 2013
Aviva
32,8%
RSA
32,6%
Direct Line
22,3%
Esure
23,8%
Admiral
19,9%
Clearly, the cost advantage against “traditional” companies like Aviva and RSA comes from the fact that they don’t have to pay insurance agents. But even compared to the direct competitors, Admiral seems to have a cost advantage. Among other things, Admiral is the only FTSE100 company located in Wales which implies quite “reasonable” salaries.
However there is a big difference compared to GEICO:
GEICO’s business model as we all know, combines low cost / direct with investing the “float” Buffet style, so every premium dollar earned is kept and invested as profitable as possible, preferably in stocks. In principle, this is the strategy of all insurance companies, but very few are able to get “Buffet like” returns.
So I have compiled 3 statistics which show that Admiral “ticks” differently:
2013
Ratio Financial income /total profit
Net retained premium
“Other” in % of profit
RSA
116,4%
93,6%
0,0%
Aviva
72,9%
88,2%
0,0%
Direct Line
35,2%
101,6%
36,3%
Esure
11,3%
91,4%
40,1%
Admiral
3,3%
25,0%
85,0%
A quick explanation of those ratios: The net profit of an Insurance company is the result of 3 major components:
a) Underwriting result
b) investment result
c) “other” stuff
The first column in the table above shows what percentage of the total result in 2013 can be attributed to the investment result. RSA for instance actually makes a loss in insurance, so more than 100% of their profit comes from the investment portfolio. Admiral, on the other end, attributes only 3% of the total profit to investments. So what’s going on here ? Do they manage their investments so badly ?
The second column explains this “conundrum”: All the other players keep more or less all the insurance premiums they are collecting. Admiral, on the other hand only keeps 25% of incoming insurance premiums, the other 75% get “ceded” to Reinsurers.
Finally, the third column shows, that Admira is actually earning most of its money with “other” stuff whatever that means. To solve the puzzle, one has to look back into history of Admiral: Admiral was founded by a Lloyds syndicate to act as a kind of “Underwriting agency” in order to generate premium for the syndicate. So from the start, Admiral had a very lean structure, selling only direct etc. At some point in time they decided that the syndicate was too expensive and that they actually want to issue the policies themselves. Nevertheless, they kept their lean set up and lined up reinsurers to shoulder the majority of the risk.
Most people familiar with Insurance would say that the concept of Admiral doesn’t make sense. Why should you give up profits both, on the insureance side as well as in investments by passing 75% ? The answer is relatively simple: Capital efficency. Most insurance companies are notouriously capital inefficient. Long term ROEs for most major players are below 10% p.a. despite often significant leverage through subordinated debt. The main reason for this is the fact, that in many jurisdictions, the “GEICO” model requires to hold a large amount of capital to buffer capital market movements. Unless you are Warren Buffet, the returns on those investments are often below average so as a result, ROEs are bad. Plus the fact that growth often requires a lot of upfront capital as well.
For Admiral, the big structural problem of course is the following: If I pass most of my premiums and cash to reinsurers, how do I then earn money ? This is where the “other” column from my table above comes into play. Due to this business model, Admrial very early concentrated on making additional money by selling “ancillary” stuff.
This is what Admiral writes in its latest annual report (by the way: all annual reports since 2003 are highly recommended for clarity and insight !!!):
Other Revenue
Admiral generates Other revenue from a portfolio of insurance products that complement the core car insurance product, and also fees generated over the life of the policy. The most material contributors to net
Other revenue are:
> Profit earned from motor policy upgrade products underwritten by Admiral, including breakdown, car hire and personal injury covers
> Profit from other insurance products, not underwritten by Admiral
> Vehicle Commission (see page 25)
> Fees – a dministration fees and referral income (see page 25)
> Instalment income – interest charged to customers paying for cover in instalments
This additional income is extremely high margin with almost no capital requirement and drives the profitability of the company.
The result
This low capital requirement leads to ROE’s which are compared to its peers “from outer space”:
Name
ROE FY
ROE 5Y
Average
16%
17%
ADMIRAL GROUP PLC
59%
59%
TOPDANMARK A/S
26%
31%
TRYG A/S
19%
21%
LANCASHIRE HOLDINGS LTD
15%
17%
BEAZLEY PLC
21%
16%
GJENSIDIGE FORSIKRING ASA
16%
15%
SAMPO OYJ-A SHS
14%
14%
GRUPO CATALANA OCCIDENTE SA
13%
14%
EULER HERMES SA
13%
13%
ZURICH INSURANCE GROUP AG
12%
12%
ALLIANZ SE-REG
11%
12%
AMLIN PLC
19%
10%
MAPFRE SA
9%
9%
XL GROUP PLC
9%
9%
RSA INSURANCE GROUP PLC
-11%
5%
Other unique aspects of Admiral’s business model
Comparison sites
Admiral runs in addition to its insurance operation, its own insurance comparison sites (e.g. Confused.com in the UK). Although those comparison sites themselves only contribute less then 10% of total profit, it gives Admiral a strategic advantage: Via their comparison site they can monitor in real time what competitors are doing and how they are pricing stuff. Other comparison sites also sell this kind of data but usually with a significant time delay. So running its own comparison site is clearly an advantage against a “normal” onilne insurer.
Capital allocation
With regard to capital allocation, again look at this statement from the 2013 annual report:
Admiral believes that having excess cash in a company can lead to poor decision-making. So we are committed to returning surplus capital to shareholders. We believe that keeping management hungry for cash keeps them focused on the most important aspects of the business. We do not starve our businesses but neither do we allow them the luxury of trying to decide what to do with excess capital.
Charly Munger would say at this point “I Have nothing more to add”. This is how it should be done but rarely found especially in the Insurance industry.
Managment & Shareholders:
The current CEO, Henry Engelhardt founded the company on behalf of the Lloyds Syndicate in 1991. He still holds ~12,8% of the company.
Co-founder David Stevens owns around 3,8%. Both founders only pay themselves ~400 k GBP per year salaries and no bonuses. The only exception is the CFO, who is relatively new. He earns around 1 mn GBP including a bonus and doesn’t have a lot of shares. There are quite some interviews available on Youtube with the CEO, among them this one is especially interesting:
Largest outside shareholder is MunichRe with 10%, who is also providing the majority of the reinsurance capacity. Other noteworthy shareholders are PowerCorp from Canada and Odey, the UK Hedge fund with a -0.79% short position. All Admiral employees are shareholders and there is a program for employes to purchase shares.
Stock price
Since going public, Admiral has performed very well:
Including dividends, Admiral returned 25,5% p.a. since their IPO against ~8% p.a. for the FTSE 100. Since 2004, EPS trippled and dividends per share increased by a factor of five. Interestingly, Admiral never traded at a level which one would asociate normally with such a growth stock, at the peak, the share had a P/E of 22 in 2006. I think this has to do with the general discomfort that many investors have with financial stocks.
Challenges for Admiral
Some of the additonal income sources for Admiral are clearly under regulatory thread. Referral fees, bundling etc. are currently investigated by UK regulators (see here and here) but especially Admiral seems to be quite creative on how to find different ways to earn fees.
Another and maybe the biggest strategic issue is that in theory comparison sites could start to sell additional products as well as we can see in the car rental market. However Admiral has the big advantage as they cover both, the comparison area and the insurance “sales funnel”.
I also think that for the comparison sites, it is not that easy to sell additional insurance products. Insurance policies are less standardized than rental cars, with very individual pricing so it is harder for a comparison site to actually close the deal intead of passing the client on to the insurer for a fee. Clearly comparison sites will try to get into this game as well but again, Admiral is the best positioned insurer.
Finally, the UK car insurance business shows almost a “brutal” cyclicality, for instance in 2013 premiums for the whole market dropped ~20%. Nevertheless, Admiral has shown that they are profitable over the cycle.
Opportunities
Admiral is currently trying to expand its business model into 4 other countries: Spain, France, Italy and the US. An earlier attempt in Germany failed a couple of years ago, mainly because the German market renews policies only once a year and Admiral was not able to really use its strengths (dynamic offers and pricing) on that basis.
If they succeed in any one of those markets similar to the UK, then there would be significant upside in the stock. If they suceed in 2 or more, Admiral could become a multibagger. If they don’t succeed at all, one could imagine that they might take additional market share in the UL, but then the upside is limited.
Although the subs are growing strongly, they still made a loss in 2013. Car insurance is however to a certain extent a scale business. You need a certain scale to become profitable. Clearly, just buying a competitor (and paying a lot of goodwill) would look better in the short term. Building up your own operations takes longer, but if you do it right, the value generation is significantly better than via M&A.
SUMMARY: Bringing it all together
Personally, I think Admiral has a very unique “outsider” business model. Reinsuring most of their business allows them to focus on the core product, car insurance underwriting and ancilliary services. They don’t have the complexity of traditional insurers with complex investments, expensive investment management and “asset liability management” departments etc. etc.
This keeps structural complexity low, lowers cost and allows them to scale up business much quicker than any “traditional” model and with very low capital intensity. Traditional insurance companies have always the option to realize investment profits in order to make results look good in the short term. In the long term, this often leads to a detoriation of the core business. Admiral doesn’t have this luxury. Additionally it insulates Admiral mostly from capital market volatility and enables them to move aggresively if other insurers are nursing their investment losses. Additionally, they don’t need to sell complicated subordinated debt etc.
Overall, I think the likelihood that someone succesfully copies Admirals business model is low, because for any Insurance executive, it is extremely counterintuitive to give premium away. Any insurance CEO would rather sell his grandmother than increase the reinsurance share and give away investment money. GEICO for instance in my opinion is not a “real” outsider company. It is a traditional insurer with a focused direct sales force. Admiral is really a very different animal.
Clearly, the thread of Google & Co is real, but on the other hand, Google & Co hesitate to to move into regulated areas. However if they would want to seriously move into this business, I would think that Admiral could be an interesting acquisition target for cash rich Google & Co.
Against the traditional competition, in my opinion Admiral has a 10 year headstart in understanding how to sell insurence and especially “others” over the internet. I think they will chuckle when they read how for instance AXA tries to become “digital” as they were already selling 70% of their policies over the internet in 2003.
I would go so far as calling the combined business model a “moat”. Yes, it is maybe not that difficult to start an online insurer and does not fit into the classical moat categories, but to scale up quickly and get the whole package right, this is another story and in my opinion very very unlikely. Even the direct clones like Esure only go “Half way” by keeping all the premiums and exposing themselves to capital market volatility.
I also think that this is still a “value investment” despite the optically expensive multiples. In my opinion, the value lies in the business model plus the headstart in online insurance. To put it into s short thesis: This is a high quality company at a “Normal company price tag” and an “above average” growth opportunity due to the cost advanatges.
For the portfolio, I had bought already a “half position” in April at 13,80 GBP per share as I have briefly mentioned in the April post. I know this is a little unfair but I just didn’t have time to finish the write up.
P.S. There will be an extra post for this, but I have sold the rest of my April SA position in order to keep the exposure to the financial sector (~20% of the protfolio including the bonds) constant
Capital Raising in Italy is always worth looking into. Not always as an investment, but almost always in order to see interesting and unusal things. I didn’t have BMPS on my active radar screen, but reader Benny_m pointed out this interesting situation.
Banca Monte dei Paschi Siena, the over 600 year old Italian bank has been in trouble for quite some time. After receiving a government bailout, they were forced to do a large capital increase which they priced in the beginning of last week.
The big problem was that they have to issue 5 bn EUR based on a market cap of around 2,9 bn.
After a reverse 1:10 share split in April, BMPS shares traded at around 25 EUR before the announcement. In true “Italian job” style, BMPS did a subscription rights issue with 214 new shares per 5 old shares at 1 EUR per share, in theory a discount of more than 95%.
The intention here was relatively clear: The large discount should lead to a “valuable” subscription right which should prevent the market from just letting the subscription right expire. What one often sees, such as in the Unicredit case is the following:
– the old investors sell partly already before the capital increase in order to raise some cash for the new shares
– within the subscription right trading period, there will be pressure on the subscription right price as many investors will try to do a “operation blanche”, meaning seling enough subscription rights to fund the exercise of the remaininng rights. This often results in a certain discount for the subscription rights
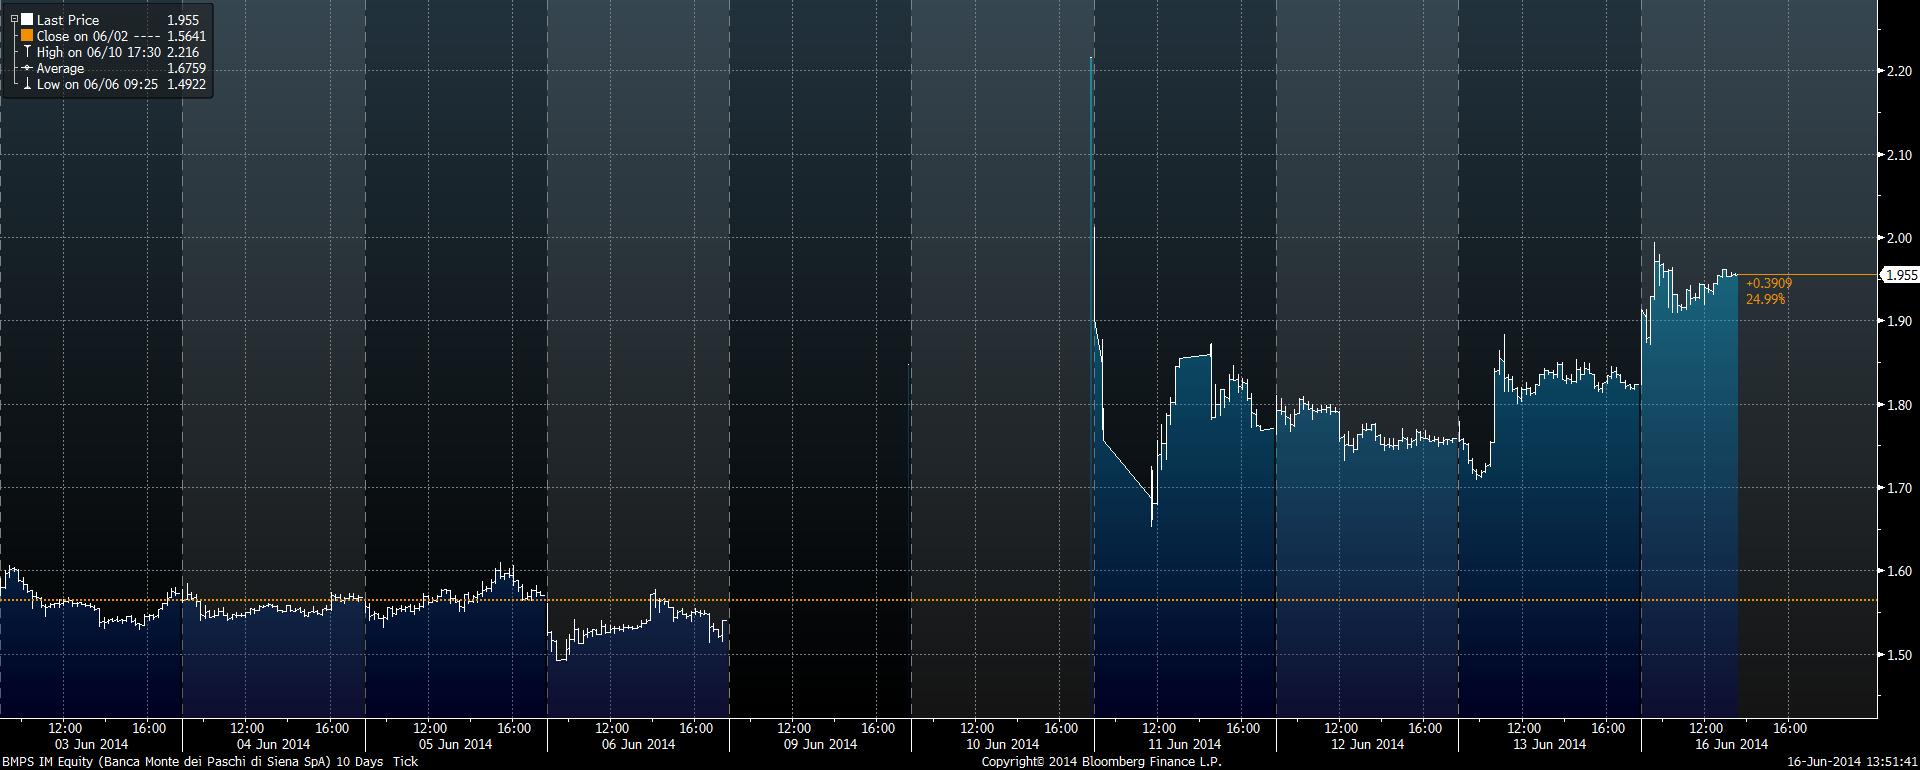
In BMPS’s case, the first strange thing ist the price of the underlying stock:
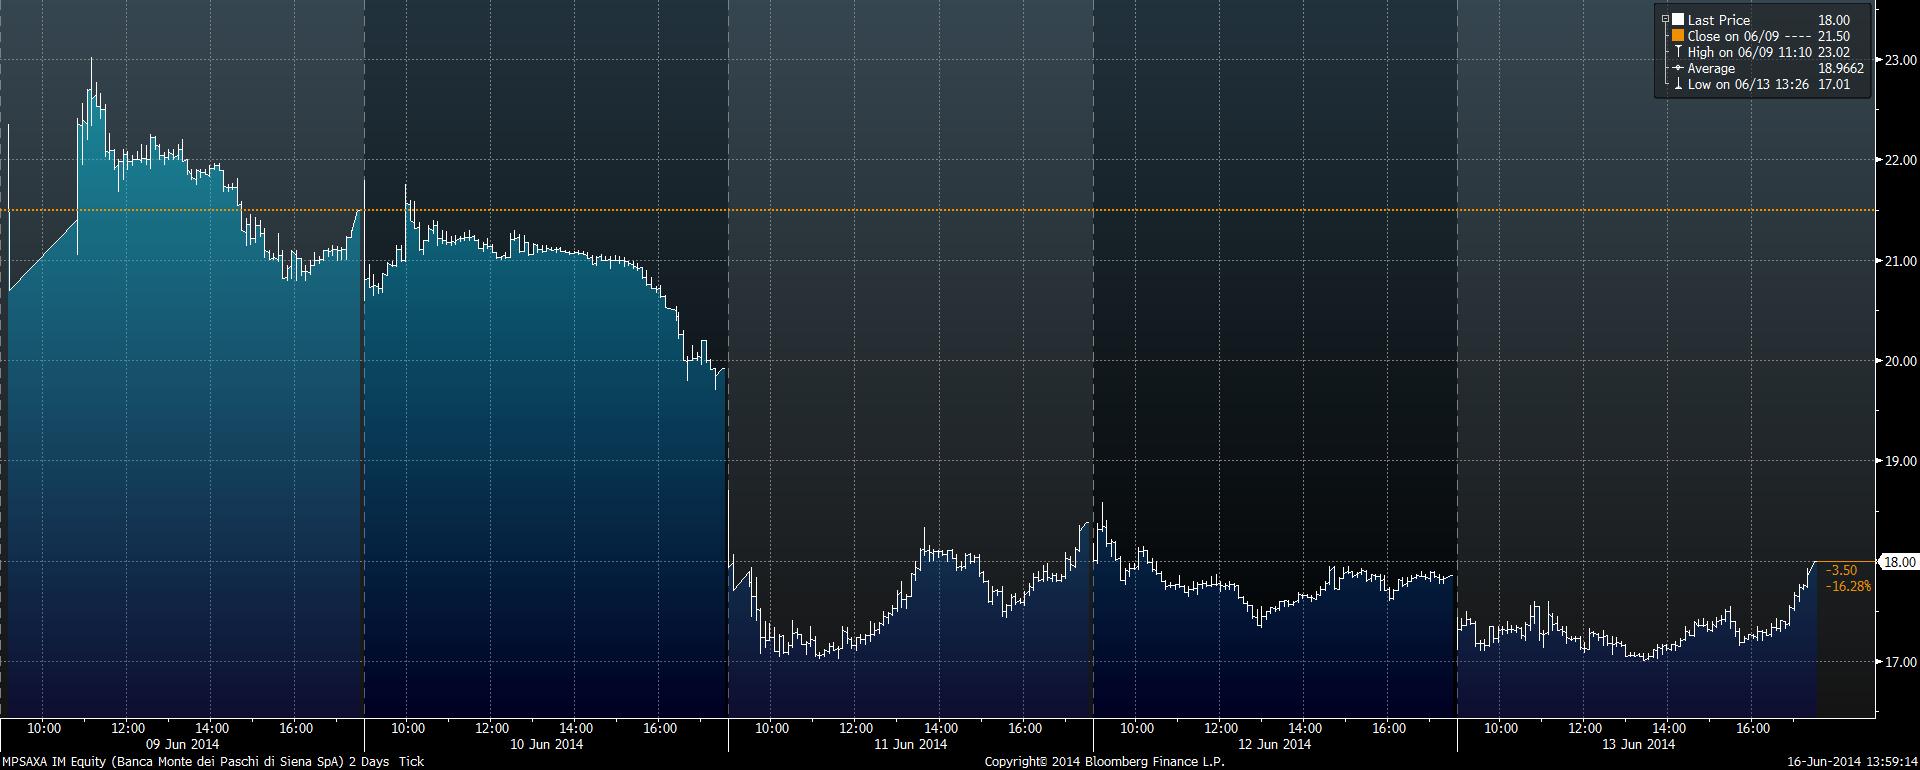
Adjusted for the subscription right, the stock gained more than 20% since the start of the subscription right trading period and it didn’t drop before, quite in contrast, the stock is up ~80% YTD. As a result of course, the subscription right should increase in value. But this is how the subscription rights have performed since they started trading:
It is not unusual that the subscription rights trade at a certain discount, as the “arbitrage deal”, shorting stocks and going long the subscription right is not always easy to implement.
At the current price however, the discount is enormous::
At 1,95 EUR per share, the subscription right should be worth (214/5)* (1,95-1,00)= 40,66 EUR against the current price of 18 EUR, a discount of more than 50%. The most I have seen so far was 10-15%. So is this the best arbitrage situation of the century ?
Not so fast.
First, it seems not to be possible to short the shares, at least not for retail investors. Secondly, different to other subscription right situations, the subscription right are trading extremely liquid. Since the start of trading on June 9th, around 560 mn EUR in subscription rights have been traded, roughly twice the value of the ordinary shares. The trading in the ordinary shares themselves however is also intersting, trading volume since June 9th has been higher than the market cap.
Thirdly, for a retail investors, the banks ususally require a very early notice of exercise. So one cannot wait until the trading period and decide if to exercise or not, some banks require 1 week advance notice or more. My own bank, Consors told me that I would need to advice them until June 19th 10 AM, which is pretty OK but prevents me from buying on the last day.
In general, in such a situation like this the question would be: What is the mispriced asset, the subscription right or the shares themselves ? Coming from the subscription right perspective, the implicit share price would be 1+ (18/((214/5)*1,95-1)))= 1,44 EUR. This is roughly where BMPS traded a week before the capital increase.
For me it is pretty hard to say which is now the “fair” price, the traded stock price at 1,95, the implict price from the rights at 1,44 or somewhere in between. As the rights almost always trade at a discount, even in non-Italian cases, one could argue that there might be some 10-15% upside in buying the shares via the rights. On the other hand, I find the Italian stock market rather overheated at the moment and the outstanding BMPS shares are quite easy to manipulate higher due to the low market cap of the “rump shares” at around 200-250 mn EUR.
The “sure thing” would be to short the Stock at 1,96 EUR, but that doens’t seem to be possible.
Summary:
Again, this “Italian right” capital raising creates a unique situation, this time with a price for the subscription right totally disconnected from the share price.
Nevertheless I am not quite sure at the moment what to to with this. One strategy would be to buy the subscription right now and then sell the new shares as quickly as possible, but it looks like that this is exactly what the “masterminds” behind this deal have actually want investors to do. They don’t care about the share price, they just want to bring in 5 bn EUR in fresh money and an ultra cheap subscription right is the best way to ensure an exercise. In this case we should expect a significant drop in the share price once the new shares become tradable. So for the time being am sitting on the sidelines and watch this with (great) interest as it is hard for me to “handicap” this special situation at the moment.
Following Mr. Draghi’s speach on Thursday, the German Stock Index DAX hit the 10.000 mark for the first time in history soon thereafter. Many major publications directly came out with headlines along the line “DAX 10000 – what’s next” and speculated where the DAX might go.
In contrast to that and only for reasons of personal entertainment, I want to take a look back into the DAX history. The DAX was introduced 26 years ago in July 1988 by the German Stock Exchange in order to introduce a modern, performance based stock index. The linked Wikipedia site gives a great overview on the history of the DAX and the change in constituents. Mathematically, the DAX times series was based on 31.12.1987 with a starting value of 1.000 although there exist some “Virtual” time series going back much further.
Just a few interesting facts about the DAX:
– only 15 of the original constituents are still in the DAX
– 3 (or 10% of the original 30) actually went bankrupt
– the best years since 1987 have been 1993 with +46,71% and 1997 with +47,11%
– the worst year were 2002 with -43,94% and 2008 with -40,37%
– the biggest cummulative loss was the 2001-2003 period with a cumulative loss -58,9%
– the Dax rarely ends up pruducing single digit returns over a full calender year. Only 5 out of the last 26 years produced “single digit” returns. So yes, long term stock returns might be single digits but short term single digit returns are an exception
Neverthess, the 10.000 level represents an annual return of ~9,02% over 26,5 years (from December 1987 until May 2014). This compares with around 10,1% for the S&P 500 (in EUR).
For me personally, the implementation of the Dax coincidently equals almost exactly when I bought my first stock. The first Stock I bought was a company called Hoesch in September 1987. I remember this so well because just a few weeks later, the “Black october of 1987” hit me with full force. I had used half of my earnings from a vacation job. As I wanted to increase my position after the crash, the people at the bank refused to take my order because they said that stocks are only for gamblers. As I was not yet of legal age back then, I had to come again with written permission of my parents to buy stocks.
This leads to another question:
Was this huge 26 year rally predictable or not ?
3 years ago I had reviewed the original “Market Wizards” from Jack Schwager which contains interviews with many then famous traders and hedge fund managers. Overall, one year after th 1987 crash, the sentiment was very very negative.
As I did not find historical P/Es for the Dax in 1987/1988, let’s look at this table of historic P/Es for the S&P 500:
P/E
31.12.1973
12,3
31.12.1974
7,3
31.12.1975
11,7
31.12.1976
11,0
30.12.1977
8,8
29.12.1978
8,3
31.12.1979
7,4
31.12.1980
9,1
31.12.1981
8,1
31.12.1982
10,2
30.12.1983
12,4
31.12.1984
9,9
31.12.1985
13,5
31.12.1986
16,3
31.12.1987
15,6
avg
10,8
Someone like John Hussmann might have said that stocks have nowhere to go as the P/E even after the 1987 crash was ~50% higher than the preceeding 15 year average. At the and of 1987, 10 30 year US Treasuries were yielding around 9%, another argument why stocks didn’t look that “apetizing” at that point in time. Why bother with stocks if you can earn double digits with corporate bonds any time ?
What followed
Looking back, it is easy to point out some of the events which led to this remarkable run especially for the DAX over the last 26 years:
– Communism broke down (“Peace dividend”)
– the Eurozone was created, stimulating cross border trading, increasing competition
– technology change (PC, Internet, Mobile)
– Corporate taxes in Germany went down form >50% to ~30%
– interest rates declined for now 25 years in a row
– old crossholding structure (“Deutschland AG”) dissolved, more professional management, foreign investors
– the BRIC story unfolded, further possibilities to export “core competency” goods like machinery and cars
In 1987/1988, few market pundits did even predict a single one of those factors. That’s why I think that just looking into the rearview (valuation) mirror should not be the only tool in the investing toolbox. Past P/Es will not predict future seismic shifts. On the other hand, one should not rely on such evcents happening over and over again and boosting share prices further. Clearly, interest rates and taxes will not fall that much lower and the effect of the end of Communism will not repeat itself.
For me the major conclusion is the following: Do not rely on any one system which tries to predict the future and/or future returns. Keep an open eye on everything, from valuations to macro economic factors and political shifts. Be prepared for surprises. Inthe long term, many surprises turned out to be positive for the economy and stock return.
Some musings on the Dax constituents
Just for fun, I created a table with the long term performance of the 15 “surviving” Dax constituents. Unfortunately I only got performance numbers back to 1992, but the p.a. Performance of the DAX was quite similar. lets look at those 15:
1987
Still in DAX
Comment
LT Perf (08/1992)
p.a.
DAX
545,14%
8,95%
Allianz *
1
177,55%
4,80%
BASF *
1
3650,23%
18,12%
Bayer *
1
1598,15%
13,90%
BMW *
1
1723,82%
14,28%
Commerzbank *
1
-70,14%
-5,40%
Continental
1
1962,28%
14,92%
Daimler-Benz (*)
1
90,50%
4,22%
Deutsche Bank *
1
89,57%
2,98%
Deutsche Lufthansa *
1
615,84%
9,47%
Henkel *
1
1200,08%
12,51%
Linde *
1
699,66%
10,03%
RWE *
1
308,71%
6,68%
Siemens *
1
742,92%
10,29%
Thyssen (*)
1
89,98%
4,32%
Volkswagen *
1
1690,10%
14,18%
Not surprisingly, financial stocks do not look good here. Overall, companies which are considered “well managed” did quite well such as Henkel, Bayer, BMW, Linde. Surprising for me is the fact that Lufthansa actually outperformed the DAX as well as Siemens.
Now let’s take a quick look at the new stocks. If I didn’t have returns from 1992, I made a comment:
Total
p.a.
Perf. Since
Adidas
1
896,84%
13,23%
1995
Beiersdorf
1
1658,99%
14,09%
Deutsche Börse
1
335,79%
11,74%
2001
Deutsche Post
1
103,80%
5,41%
2000
Deutsche Telekom
1
62,22%
2,80%
1996
EON
1
485,63%
8,46%
Fresenius
1
4651,42%
19,42%
Fresenius Medical Care
1
174,05%
5,90%
1996
HeidelCement
1
242,80%
5,83%
Infineon
1
-80,66%
-10,95%
2000
K&S
1
3084,30%
17,24%
Lanxess
1
302,98%
16,11%
Merck
1
555,53%
10,64%
1995
Munich Re
1
300,42%
7,24%
1994
SAP
1
3502,32%
19,98%
Not surprisingly, the best “newcomers” also lead the total Dax performance. Smaller companies which grow big are always the best investments, although it is often hard to identify them before.
Finally one other table. Let’s look at some of the best performers and their historical P/Es:
FRE
SAP
HEN3
BEI
BAS
31.12.1992
28,6
24,4
19,6
18,9
11,4
31.12.1993
35,2
25,8
25,7
22,8
28,0
30.12.1994
19,4
36,7
15,0
20,6
14,6
29.12.1995
33,0
55,2
18,4
18,9
7,8
31.12.1996
64,4
52,1
25,9
28,7
14,4
30.12.1997
49,2
61,1
29,5
46,8
12,0
30.12.1998
30,8
71,5
32,8
30,4
11,8
30.12.1999
27,1
83,7
26,2
32,5
25,3
29.12.2000
37,7
60,0
21,7
41,9
23,6
28.12.2001
183,3
78,5
18,3
38,1
20,7
30.12.2002
10,8
46,3
20,0
31,3
13,9
30.12.2003
23,0
38,1
17,1
27,3
27,5
30.12.2004
18,2
30,9
5,3
21,9
14,5
30.12.2005
20,1
31,5
16,2
23,7
11,3
29.12.2006
23,5
26,2
18,9
16,7
11,6
28.12.2007
21,5
22,3
18,1
27,2
12,1
30.12.2008
21,2
15,5
54,7
16,8
8,9
30.12.2009
14,2
22,3
26,4
27,8
28,2
30.12.2010
16,3
24,9
18,1
29,7
12,0
30.12.2011
16,9
14,0
16,7
39,8
8,0
28.12.2012
16,3
25,8
18,3
31,6
13,6
30.12.2013
19,7
22,3
23,1
31,3
14,7
We can easily see that quality and growth NEVER is cheap. I am not sure if that Henkel 2004 P/E of 5 is incorrect data, but the solid “quality stocks” always traded “richly” and nevertheless delivered outstanding long term performance. Only BASF, as a “quality cyclical” company has been available at single digit P/Es at some years.
So after all, this is wat Warren B. likes to tell us: In the long term, quality does seem to beat anything else, especially if you factor in taxes, trading costs etc.
Summary:
So what does this all tell us ? I am afraid that I cannot come up with some “Magic Formula” to identify future winners. Nevertheless, I think the look back emphasizes three of Warren Buffet’s main points:
1) over the long term, stocks have been a unbeatable compounding machine. A return 10 times the original inevstment in 26 years despite several devasting crashes speaks for itself
2) over such a long time horizon, it seems that “quality buy and hold” seems to be at an advantage at least for large caps. Yes, introducing a backtested system (market timing, EV/anything) could generate fantastic returns as well, but just buying and holding well managed companies did produce spectacular returns
3) Just buying the index and sitting on one’s ass would have beaten almost all active strategies. To be fair although, the first DAX index funds were available mid/end 90ties…..
P.S.: To finish the story: What happend to my first stock, Hoesch AG ? Hoesch was taken over by steel company Krupp which itself merged with Thyssen. If I would held it all the time, it would have been a pretty weak investment……
A very comprehensive paper on dividends and share buy backs from Credit Suisse
And finally a non-financial link: I had the chance to see a live concert of Charles Bradley, a great “Old school” soul singe. The guy was only “discovered” at the Age of 63, a great example that is never too late for anything:
Via my “home forum”, someone brought up the Latvian Pharma company Grindeks AS. The company looks similar form the business model to Hungarian company EGIS and Croatian Krka which I covered some months ago
Valuation wise, the stock looks like a clear “no brainer”:
ROIC, ROE, net margins all solid “double digit” numbers. My own, mechanical “Boss Score” would indictae a fair value of at least 3 times the current market cap.
The only issue coming up is the fact that the company never paid a dividend.
There is also a quite obvious reason why the stock is cheap: The majority of sales goes to neighbouring Russia, which clearly is not very popular with investors these days. As I do not have an issue with this “Headline risk” as long as I get compensated accordingly, I looked into the annual report 2013 in order to find out more.
As with Australian Vintage, I scan the report for unusual or problematic things first.
In Grindeks case, I was puzzled by a quite unusual balance sheet position called “Advance payments for financial investments “ something which I haven’t seen before. The explanation in the notes says the following:
In 2012 the Company has signed purchase agreement with Dashdirect Limited regarding purchase of the controlling interest in the equity of HBM Pharma (Slovakia). As of the date of signing these financial statements the agreement is partly completed. The main activity of the HBM Pharma is production of the medical substances. As of December 31, 2013 the Company’s and Group statement of financial position contains advance payments related to the before mentioned purchase agreement in the amount of EUR 11,670,000. The Group management is certain that this deal is going to be finalized during 2014.
In my experience, it is not uncommon to take over M&A targets in several steps, but it is quite uncommon to pay money first and get nothing in return. A few days ago, Grindeks issued another news item which covered this strange transaction.
The numbers look OK, Grineks seem to pay only 6 times P/E of the target company. However another sentence looked strange:
Orders of JSC «Grindeks» make up about 30% of the total “HBM Pharma” s.r.o. turnover
So they are buying a company where they are the biggest customer anyway, also strange. So I decided to google a little bit and found this:
On July 8, 2010 Lithuanian-domiciled Central and Eastern European (CEE) specialty pharmaceutical company Sanitas, AB sold its 100% shareholding in subsidiary HBM Pharma s.r.o in Slovakia to Latvian company Liplats 2000, SIA. HBM Pharma was primarily engaged in toll manufacturing activities and the entity has been sold with all of its existing toll manufacturing contracts. As previously announced, sales, marketing and regulatory divisions in Slovakia and the Czech Republic were separated from HBM Pharma and retained in Sanitas Group prior to the divestment.
Sanitas acquired HBM Pharma (previously named Hoechst Biotika) from Sanofi Aventis in July 2005.
So a Latvian company called Liplats 2000 bought HBM in 2010. Googling further, I found this document on HBM’s website, describing a cross border merger between Liplats 2000 and HBM. The most interesting part of this document ist the last line in the final page: From Liplats side, a guy called Kirovs Lipman signed.
Now Kirovs Lipmans happens to be the majority shareholder of Grindeks. So effectively, Grindeks is buying this M&A target from theit majority shareholder (and former CEO). This is from Grindeks annual report:
Kirovs Lipmans – Chairman of the Council Born in 1940. Kirovs Lipmans has been the Chairman of the Council of “Grindeks” since 2003. Simultaneously K.Lipmans is also the President of the Latvian Hockey Fede
ration, the Member of the Executive Committee of the Latvian Olympic Committee, the Chairman of the Board of “Liplats 2000” Ltd. and JSC “Grindeks” Foundation „For the Support of Science and Education”, the Chairman of the Council of JSC “Kalceks” and JSC “Tallinn pharmaceutical plant”, also the Member of the Council of JSC “Liepajas Metalurgs”. Graduated from the Leningrad Institute of Railway and Transport
So to summarize it at this point: Grindeks never paid any dividends but makes a major acquisition and pays money upfront to a company controlled by the majority shareholder, without any disclosure of this potential conflict of interest.
Of course, theoretically, this could have been an “arm’s length” deal with no disadvantages for Grindeks, but the probability that something is “fishy” is quite high, combined with the fact that they never paid dividends.
Maybe I am too cautious here, but an undisclosed significant “related party” transaction is a big red flag for me.
Just to be clear: A “red flag” doesn’t need to be the ultimate “value driver”. Reply SpA is a good example. Since my “red flag” alert, the stock made a whopping 276% return.
Summary:
For me, Grindeks is, depsite the attractive valuation, an absolute no -go. Undisclosed related party transactions combined with a lack of dividend makes this a speculation rather than a value investment. I don’t know if there are Corporate activists in the baltics, but this would be a good target. Additionally, they seem to have some specific operating issues as well, so no buy, watch only.
May was a strong month for the Benchmark (Eurostoxx50 (Perf.Ind) (25%), Eurostoxx small 200 (25%), DAX (30%), MDAX (20%)) with a gain of 3,2%. The Portfolio made 0,8%, an underperformance of -2.4% in May. YTD, the portfolio is up 9,2% against 5,3% for the benchmark. Interestingly, the portfolio was up every single month this year whereas the benchmark only was positive in February and May.
Best performer in May were the 2 Russian stocks (Sberbank +21,2%, Sistem +20,4%), Koc Holding (+8,6%) and Cranswick (+5,6%), loosers were Portugal Telecom (-12% without dividend), IGE & XAO (-5,4%) and TGS Nopec (-5%).
Portfolio transactions May
Major transactions in May were:
– Sale of second half of the Sias Position at 8,75 EUR (and missing the 5% rally in the last 2 days…..)
– Purchase of TRY 2020 Depfa Zerobond
– Increase of LT2 Depfa 2015
Cash is now at ~10% plus the 5% in the LT2 Depfa 2015 which I consider “cash equivalent”. The portfolio as of May 31st can be seen as always under the “Current Portfolio” page.
Comment: “Leave the driver in the bag”
Anyone who plays golf (yes, I play as well but badly….) likes to swing with the biggest club, the driver. If you hit the ball right, you hear a satisfying sound like “Ziiiinggg” and the ball goes really far. The problem ist the following: For most golfers it is quite difficult to control the direction. On the other hand, especially for players with high (bad..) Handicaps, you need the distance in order to have a fair chance for a good score.
More often than not, especially if you play on older golf courses, you are faced with a similar view from the tee-off:
Trees to the left, trees to the right and only a very narrow fairway and you cannot see the flag. If you hit the ball into the trees, you might not be able to find it and you get a penalty, destroying your chances on a decent score. Or you find the ball, but you need several strokes to get out of the trees again.
The much more reasonable strategy for an average golf player is to use a shorter club where the distance is much shorter but you have better control on the direction. Yes, if you hit the driver straight, you will be much better off than with the iron, but ane iron gives you a much higher probability to stay on the fairway. For professional players, this is a quite common problem. Especially if you play tournaments over 4 days where every stroke counts, one bad hole (out of 72) can kill the whole tournament. So professional golf players have to be pretty good in probablilities. They have to assess constantly what club gives them the overalll probability to get the best total score from any situation.
So why do I tell this “golf stories” ? The answer is easy, an investor is facing the almost same problems than a professional golf players. You can make really risky investments, like for instance a concentrated position in an expensive growth stock which would be the stock equivalent of a driver. Or a super cheap “deep value stock” with management problems and a high debtload. Great upside potential but also big risk the end up in the “trees”. As in golf, the investment environment plays a big role in deciding what amount of risk to take. When markets are cheap in general, then taking risk makes more sense as you are facing a nice and wide fairway.
If valuations are high and a lot of strange things are going on, you might want to leave your driver in the bag and use the investment equivalents of short woods or irons, like smaller positions and more defensive stocks.
The current market environment, especially in the “developed” markets with low yields to me looks very similar to the narrow fairway from above. Relatively high valuations, experiments from central bankers etc etc. in my opinion is faced best with a more “controlled” game, like smaller position more diversification, a prudent cash position and uncorrelated risks. Otherwise the risk of permanent loss of capital and missing the “Cut” is real.
What we actually see in the markets is currently the opposite. Especially pension funds, insurance companies and sovereign wealth funds are “taking out the big clubs” by increasing the risk of their portfolios to compensate for low yields. Suddenly real estate, private equity, high yield corporate bonds and illiquid infrastructure loans are considered perfect investments for conservative pension funds and life insurance companies. Those investors are betting fully on being able to “Control the driver” whereas in reality they might not even had a practice swing before. In my opinion there is a high risk that many or most of those investors will find themselves “in the trees” at some point in the future and cursing themselves for not being prudent before.
So my advice for anyone would be: Now is not the time to “swing for the fences”. Try to stay in the middle of the investment fairway with controlled (and known) risk taking. Don’t take badly priced illiquidity risk and/or credit risk. Don’t buy badly managed companies or troubled business models with concentrated position. On the other hand, don’t stop “the game” completely but play patiently and wait for the “wide fairways” i.e. low valuation environments in order to bring out the driver again.