HEALTH WARNING & DISCLAIMER This is not Investment Advice. The stock discussed in this post is a “Pink Sheet” OTC stock with limited liquidity and almost no reporting. The author may own, buy or sell shares in this company without pre-warning. DO YOUR OWN RESEARCH !!
As a change to previous write-ups, I will start with the sound track for this write-up. And of course it is “Rocket Man” from Elton John. It fits in more than one way to this Special situation and you maybe want to listen to it while reading the write-up.
As again, this write-up became a little bit longer, I’ll just show the “elevator pitch” here but will embed the PDF document.
0. Elevator Pitch
Rocket Internet AG, a former German Venture Capital super star company run by the Samwer brothers has gone “dark” and delisted in 2020. Since then, the stock price languished until more recently, when a German activist sent an open letter to Management and the auditors criticizing the “low balling” of accounting numbers. Diving a little bit deeper, some true gems are hidden in Rocket Internet’s portfolio, especially a participation in SpaceX and prediction market superstar Decacorn Kalshi. The current share price reflects most likely less than 50% the current NAV. In my opinion, the upcoming SpaceX IPO and further positive development of Kalshi could maybe act as a “catalyst” and lead to a higher share price. In addition there is a (low) chance that Rocket Internet might distribute another special dividend as they did in 2024.
In between, the bank run accellerated and SVB was then closed and rescued by the FDIC. In the age of social media, there is now a lot of coverage on this event available, personally I found this Odd Lots Podcast Episode helpful as well as Matt Levin’s take. Matt Levin also has an answer on why SVB was not sold over the weekend: In the wake of the GFC, many of the banks who bought failing lenders were then punished with lawsuits and it seems that something like this could happen to SVB as well.
Current consensus is that SVB failed both, because of very unwise interest rate bets on its asset side as well as an unhealthy concentration of its depositor base connected by a few big VCs on its liability side. According to many stories, SVB was a very active member of the Silicon Valley VC ecosystem and somehow the VCs (and startups) basically killed the Goose who laid them golden eggs with this bankrun. In the current difficult funding environment, It would have made more sense fot the VCs to support the bank but I guess they were all in panic mode.
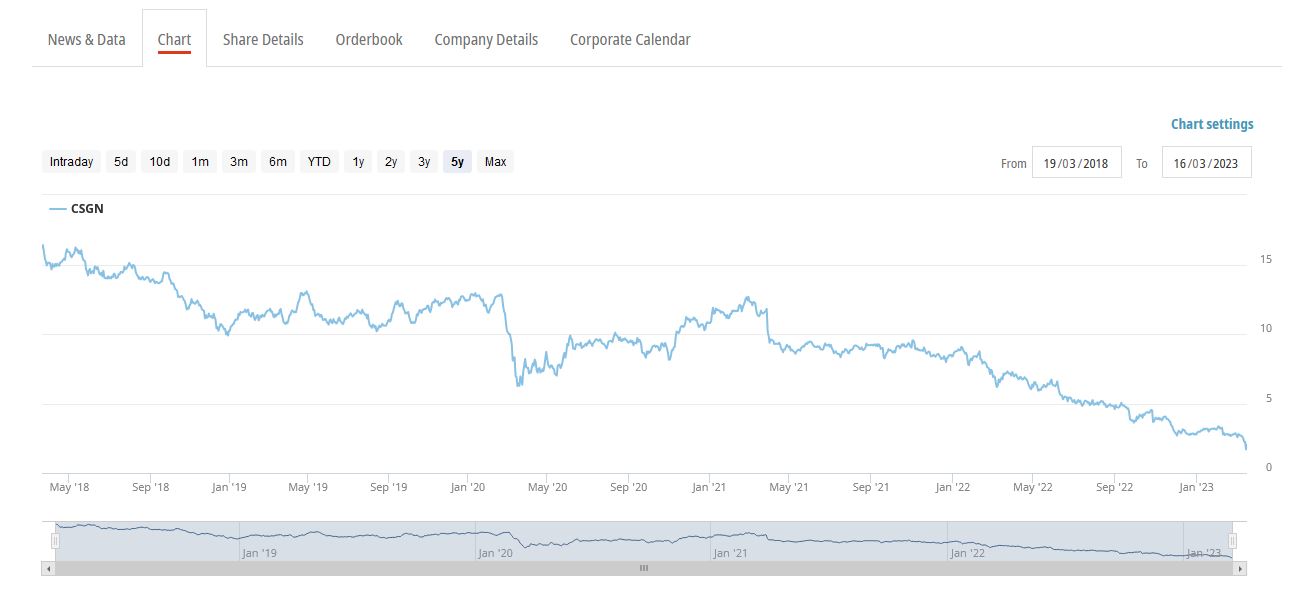
CS was a slow moving train wreck ever since the former McKinsey “Wunderkind” Tidjane Tiam took over as CEO in 2015. When he was fired in 2020, not only it was revealed thaty he used private investigators to spy on fellow board members, but more importantly, Credit Suisse was involved in almost every major fuck-up in the last few years. A few examples:
Looking at the CS share price, it is pretty obvious that there is literally no bottom:
Although it is always very difficult to make predictions, I personally think that a true and lasting turn-around for CS is very unlikely. There are very few cases in banking history where a financial institution survived such a “clusterfuck”. Credit Suisse would not be the first big name in Banking that just disappears. Besides Leahman and Bear Stearns, who remembers Salomon Brothers, DLJ, Bankers Trust, Barings, Smith Barney, Chemical Bank, Dresdner Bank and all the others ?
The most likely scenario in my opinion will be that the ring-fenced Swiss operation will somehow survive. What that means for Bondholders and shareholders on Group level is open, but in my opinion the CS shares are at best a “far out of the money option” on a very optimistic scenario. Of course anything can be traded profitably in the short term, but mid- to longterm, a complete loss of capital is very likely for CS shareholders.
Today: First Republic Bank
First Republic, a “mid sized” 200 bn plus US bank with ~21 that banks to “High net worth clients in costal regions” continued its plunge and said it would be open to almost anything, including a fire sale in order to survive.
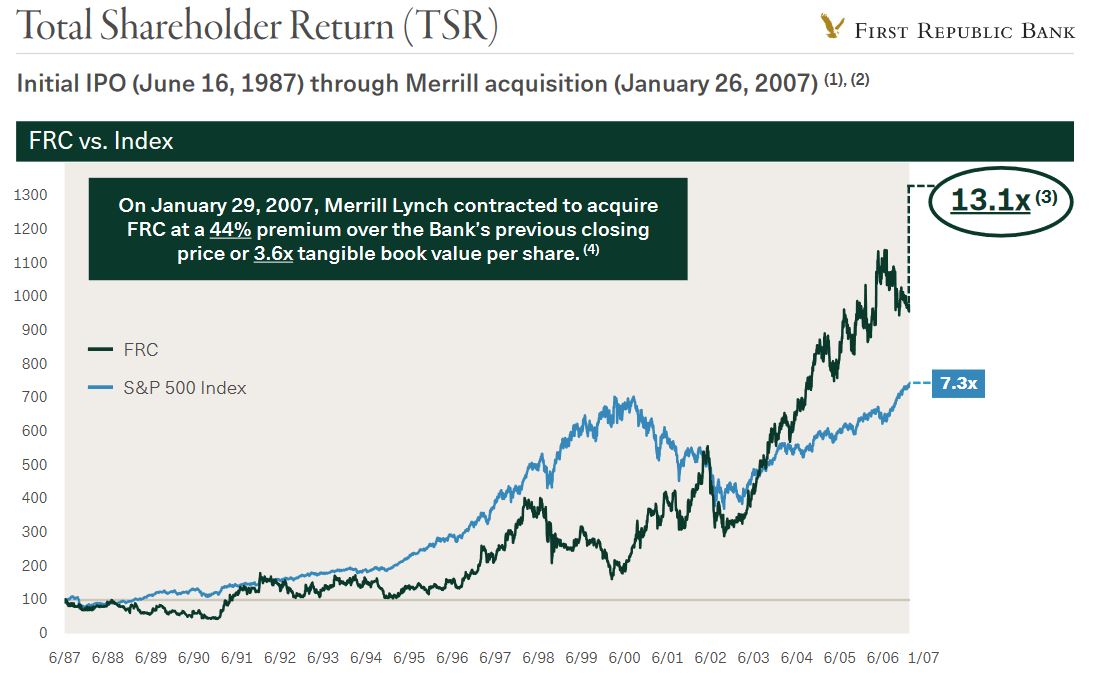
When reading the January invetsor presentation, First Republic looks like an absolute success story, among others, their share price went up 13x since 1987, almost 2x the level of the S&P (i guess ex dividends) which is remarkable for a bank:
However, looking at these slides, it becomes relatively clear where the problems of Republic are: Funding is mostly via deposits:
The deposits are mostly business accounts and larger size:
And, the Asset side consists mostly of “coastal real estate loans” and business loans to venturec Capital funds, both assets that might be in trouble:
To be honest, If I would have known about First Republic earlier and read the investor presentation, I might have considered it as a potential investment. The bank also traded at unusual high P/E multiples in the range of 20-30 earnings, so very few investors
Next week and thereafter: Whatcould be the more lasting effects of this episode ?
I guess that for the next two or more weeks, the market is “hunting” for further weak players and all of them will be backstopped by their respective Governments and Central Banks. A “Lehman moment” in my opinion still remains a very low probability scenario. However it is also clear that this whole development might have wider consequences.
For the banks, it will be even more difficult to transform short term deposits into longer term assets, which by definition is one of the main function of the banking system. For the US, more and tougher regulation is already on the way.
Among other side effects, overall the current development will most likely increase funding cost and limit borrowing capacity for the banking sector. This in turn will make it more difficult for borrowers to obtain or roll over bank loans. And if borrowers are able to obtain bank loans, they will need to pay higher credit spreads. A certain increase in Corporate Credit spreads was already observable in the past few days.
Overall this could have a siginficant impact on business activity as the availability of bank loans is a leading indicator for economic activity. This in turn could then lead to the second part of the cycle, the real credit cycle with more defaults etc.
Depending on how inflation rates are developing, the central banks might counter with lower interest rates, which however, do little to make lending easier for the banks. Of course, Governements and Central banks will try to counter a big credit squeeze, however without tighter credit conditions it is unlikely that inflation will cool off quickly.
I need to emphasize here that I am not a Macro guy at all, but overall, I think the probability for a real credit cycle has increased significantly. As a consequence, in my opinion one should limit exposure to exposed financial companies as well as businesses with near or mid term funding requirements.
Another week and the war still goes on. My subjective feeling is that currently, a surprising large amount of investors still believe that this war will end relatively soon, one way or the other. However, if the war will last for a few years, we would be still far away from a turning point with a lot of escalation potential (stopping the oil and gas pipelines, “dirty weapons”, tens of millions of refugees etc). In the short term however, especially in European markets we could see some rallies if some good news is surfacing.
Consequences As mentioned already, I desperately hope (and still pray) for a quick end, but mentally, as an investor, I prepare for a much longer conflict. What does that “preparing mentally” mean ?
I usually do favorable reviews of book because I don’t write about the bad ones. However this book is even exceptional among the many very good books I have written about.
There are some books that give you a new idea and/or explain something that I could never explain myself. This book created so many “Aha “moments for me that I am not sure if I have gained the same amount of new knowledge from any other book in the recent years.
In the first 6 months of 2020, the Value & Opportunity portfolio gained +0,9% (including dividends, no taxes) against a loss of -9.6% for the Benchmark (Eurostoxx50 (25%), Eurostoxx small 200 (25%), DAX (30%), MDAX (20%), all TR indices).
Links to previous Performance reviews can be found on the Performance Page of the blog. Some other funds that I follow have performed as follows in the first 6M 2020:
Partners Fund TGV: +0.9% Profitlich/Schmidlin: -4,1% Squad European Convictions -4.7% Ennismore European Smaller Cos –7.49% (in GBP) Frankfurter Aktienfonds für Stiftungen -13.5%
Evermore Global Value -23.6%(USD)
Greiff Special Situation -4.2%
Squad Aguja Special Situation -0.2%
Since inception (01.01.2011), this translates into +193,0% vs. 93.1% for the Benchmark.
Nikola is a company I haven’t heard of until a week ago or so. It is a pre-revenue, prototype-product company that according to their web site develops Hydrogen fueled and electric trucks.
The VC past
The company did a Series D funding round in September last year at a pre-money valuation of 3 bn USD which is quite remarkable for such an early stage company and they seem to have received ~500 mn USD from corporate partners CNH, Bosch and Hanwa. Although the valuation would raise some eyebrows, this would be still not considered super crazy by VC standards if they have a great team and great technology assets.
This is actually the second autobiography of a founder with the surname Schwab that I review. After tire trader Les Schwab, this book is written by the founder and name giver Charles “Chuck” Schwab who founded the financial services company with the same name.
When Mike Tyson was asked by a reporter whether he was worried about Evander Holyfield and his fight plan he answered; “Everyone has a plan until they get punched in the mouth.”
This is how the current crisis developed so far for me personally and that is why i decided to do this more frequent “Panic journal” in order to document my actions and to hopefully learn a thing or two.
There are a lot of articles currently about the “Great Financial Crisis” which culminated exactly 10 years ago when Lehman Brothers collapsed on September 15th 2008. There is still a lot of discussion around who is to blame for this, however most of this is nonsense as Barry Ritholz nicely summarized here.
My personal story is relatively short but quite lucky: Due to my “day job” back then, I saw many early warning signs in 2007. Although I had no idea how deep the crisis would be, I got mostly out of the stock market by the end of the year 2007.
This was maybe my only successful timing action I ever managed to do with some success. I even made some decent money with shorting that I had just discovered back then and a was on track to positive performance in 2008 when I was caught in the mother of all short squeezes, the famous “Porsche Volkswagen corner” which cost me more than -10% portfolio performance.
Nevertheless especially the years following the crisis taught me some important lessons which I wanted to share:
As I mentioned in the comments a few days ago, I sold my complete Metro position at around 12,30 EUR /share. Including a 0,70 EUR dividend, this translates into a -26,6% loss and is a new entry into my “flop 10” list.