Category Archives: Performance Review

Performance June 2013

Performance June 2013:

Performance in June 2013 for the portfolio was -1.6% against -4.3% of the BM (50% Eurostoxx, 30% Dax, 20% MDAX). YTD, the portfolio is up +17.7% against 7.1% for the BM.

Interestingly, this was the first negative month for the portfolio after 18 consecutive positive months, for the BM the “run” were 12 months of positive returns. The positive aspect is the fact, that the draw down was a lot less than the benchmark, even adjusted for cash.

Graphically this looks as follows:

Positive contributors were EGIS (+6.6%), Rhoen (+6.5%). Loosers were SIAS (-15,1%), EMAK (-12,4%), AS Creation (-7,1%).

Portfolio transactions

As discussed, I closed the Kabel Deutschland short after the official offer of Vodafone. The result was a loss of ~-22% on this position.

Only new entry of the month was Thermador. In order to remain within my 20% allocation to France, I sold Bouygues at the same time, resulting in a profit (incl. dividend) of ~+11%.

Portfolio as of 30.06.2013

Name Weight Perf. Incl. Div
Hornbach Baumarkt 3.7% 2.4%
AS Creation Tapeten 4.0% 39.2%
Tonnellerie Frere Paris 5.8% 81.6%
Vetropack 4.1% 6.6%
Installux 2.7% 14.2%
Poujoulat 0.9% 11.4%
Dart Group 4.7% 167.3%
Cranswick 5.7% 37.0%
April SA 3.5% 12.5%
SOL Spa 2.7% 31.5%
Gronlandsbanken 2.2% 23.2%
G. Perrier 3.2% 18.8%
IGE & XAO 2.0% 4.8%
EGIS 2.8% 7.6%
Thermador 2.7% 1.5%
     
KAS Bank NV 4.7% 28.7%
SIAS 4.8% 36.7%
Drägerwerk Genüsse D 9.1% 180.1%
DEPFA LT2 2015 2.6% 58.3%
HT1 Funding 4.6% 56.2%
EMAK SPA 4.6% 45.1%
Rhoen Klinikum 2.3% 18.1%


Short: Prada -1.0% -15.3%
0 0.0% 0.0%
Short Lyxor Cac40 -1.1% -11.0%
Short Ishares FTSE MIB -1.8% -3.6%
     
Terminverkauf CHF EUR 0.2% 6.9%
     
Cash 20.4%  


Value 50.5%  
Opportunity 32.9%  
Short+ Hedges -3.7%  
Cash 20.4%  
  100.0%

Comment

Nothing really new.

Performance review May 2013 – Comment “Position sizing”

Performance:

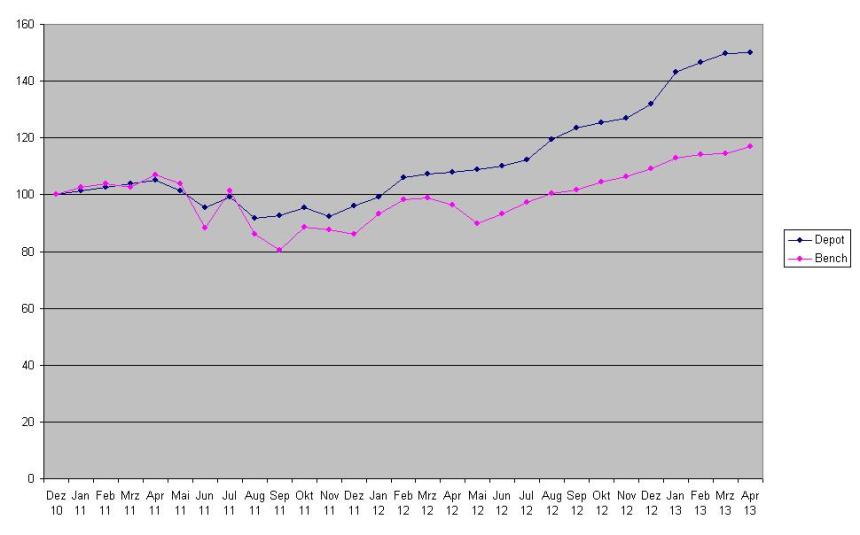
May has been s surprisingly good month for the portfolio. Despite ~15-20% cash, the portfolio gained +4.9% against +4.5% for the benchmark (50% Eurostoxx, 30% Dax, 20% MDax). YTD this results in +19.6% against +12.0% for the Benchmark. Since inception (Jan 1st 2011), the score is now +57.7% against 22.1%. As I have said many times, this is still highly unusual if the portfolio outperforms in such a strong month, especially now with the high cash percentage.

Main drivers were: EMAK (+27%), Dart Group (+22%), April (+16%) and Tonnellerie (+13%)

Portfolio activity

May has been an unusual active month. As discussed, the following transactions took place:

– sale of IVG convertible with a total loss of -16,3%
– sale of Buzzi with a total gain of +34% (incl. dividends)
– Sale of KPN shares & rights with a gain of 11.1%
– Purchase of IGE & XAO
– Purchase of EGIS
Edit: – Short Position Focus Media has actually been bough, exit with a loss -11.9%

Portfolio as of May 31st 2013:

EDIT: Buy out of Focus Media updated

Name Weight Perf. Incl. Div
Hornbach Baumarkt 3.7% 3.4%
AS Creation Tapeten 4.3% 49.3%
Tonnellerie Frere Paris 5.7% 83.3%
Vetropack 4.1% 9.7%
Installux 2.7% 10.1%
Poujoulat 0.8% 6.4%
Dart Group 4.7% 171.2%
Cranswick 5.4% 33.8%
April SA 3.6% 19.4%
SOL Spa 2.7% 35.8%
Gronlandsbanken 2.1% 23.2%
G. Perrier 3.0% 11.3%
IGE & XAO 2.0% 4.1%
EGIS 2.5% 0.4%
     
KAS Bank NV 4.6% 27.6%
SIAS 5.5% 59.5%
Bouygues 2.4% 7.0%
Drägerwerk Genüsse D 9.2% 186.2%
DEPFA LT2 2015 2.7% 64.1%
HT1 Funding 4.6% 58.2%
EMAK SPA 5.2% 64.9%
Rhoen Klinikum 2.2% 10.8%


Short: Prada -1.0% -20.4%
Short Kabel Deutschland -1.0% -5.7%
Short Lyxor Cac40 -1.2% -15.5%
Short Ishares FTSE MIB -2.0% -14.0%
     
Terminverkauf CHF EUR 0.2% 7.9%
     
Cash 21.0%  


Value 47.5%  
Opportunity 36.4%  
Short+ Hedges -4.9%  
Cash 21.0%  
  100.0%

Comment “Position sizing”

One topic which constantly bugs me is how to size positions.

There are two extremes:

On the one side, Modern Portfolio Theory (MPT) says that the only kind of “free lunch” available is diversification. Adding additional positions means more or less the same returns but with lower risk.

On the other side are very succesful investors, including of course our heroes, Warren and Charlie, argue that one should concentrate on the big ideas only as those are the ones which drive the returns. Similar results come out of the “Kelly criterion” which says that you should bet overp proportionally more if the odds ar in your favour.

Personally, as a “part time” investor, I have the following problems:

1) I can oversee only a limited amount of companies&investments, my max is around 25-30 based on experience. So further diversification on a single investment level does not make sense

2) As I am in general very sceptical and commit only a limited time per day on research, I never really came to a stage where I was 100% sure about any investment. Even if I am 95% sure I have the nagging feeling that I missed something

3) I usually find my “edges” only in small cap stocks or smaller special situations. Small companies have much more unique risk factors than large caps. It is a real difference in risk if you invest lets say 40% into a small French software company than investing 40% of your portfolio into an international company like American Express

Point 2) is really the major issue why I hesitate to commit more than 10% of my portfolio into a single stock. I am just not confident enough in any company or investment to do so.

Looking back, my historical best investments, like for instance German bank hybrid in 2009 was made under a lot of uncertainty and I didn’t really know for sure if it plays out the way it did. The same goes for Draeger. Yes it was a multi bagger, but at least for me I was never really sure about it.

On the other hand, some small ideas where I didn’t really have a lot of conviction, performed outstanding, like Dart Group which was rather a kind of “mechanical” buy. Also sometimes a basket approach to risky or very illiquid small caps (France) makes sense.

In general, I think that there is no single optimal strategy for postion sizes. As every part of the investment process, this has to fit with the overall character of the investor, including risk tolerance, investment style and time available. With regard to the “kelly formula”, I have the fundamental problem that I neither determine the payouts nor the probabilities, so this is not a big help eithet.

For the time being, I do not have a better system for my personal situation than my current one which looks like this:

–> Full positions at 5% (increase via peformance until 10%)
–> half positions at 2.5% if I buy into a stock
–> plus a basket approach for my illiquid French small caps.
–> occasionally small position for “half baked” ideas
IMPORTANT: Weed out weak conviction positions if overall numbers of investments get close to 30 single stock investments (long & short, ex index hedges)

So far it has worked quite well, but there is always room for improvement.

Performance April 2013 & comment: “All time highs”

Performance April 2013:

Performance for the month April was +0.5% against +2.1%, an underperformance of -1.6% vs. the Benchmark (50% Eurostoxx, 30% Dax, 20% Dax). YTD, the portfolio is up 14.0% against 4.9% for the Benchmark.

For some reason, the underperformance in April reassures me that my strategy is working. I would assume in “up months” a weaker performance than the benchmark, in down months a significant better relative performance. However, in the first 3 months of 2013, the portfolio strongly outperformed although we had seen 3 “up months” in a row and I ran at ~15% net cash in the portfolio. Despite the nice developement, one has to ask if there isn’t a lot of “hidden beta” in the portfolio.

However the current month shows that the stocks do have “their own life” versus the benchmark. For instance Tonnellerie, which acted like a high beta stock in the beginning of the year came down to earth with a -17,7% performance in April. As a reader asked me for it, here is the graphical performance since Inception:

Portfolio as of 30.04.2013:

Name Weight Perf. Incl. Div
Hornbach Baumarkt 3.8% 2.8%
AS Creation Tapeten 4.7% 55.2%
Tonnellerie Frere Paris 5.3% 62.2%
Vetropack 4.4% 7.4%
Installux 2.8% 8.7%
Poujoulat 0.9% 6.4%
Dart Group 4.1% 124.0%
Cranswick 5.4% 26.6%
April SA 3.3% 4.2%
SOL Spa 2.7% 25.4%
Gronlandsbanken 2.2% 23.2%
G. Perrier 3.0% 4.8%
     
     
KAS Bank NV 4.7% 23.0%
BUZZI UNICEM SPA-RSP 5.2% 24.8%
SIAS 5.4% 48.6%
Bouygues 2.6% 10.2%
Drägerwerk Genüsse D 10.1% 193.0%
IVG Wandler 4.1% -17.7%
DEPFA LT2 2015 2.7% 58.8%
HT1 Funding 4.7% 56.4%
EMAK SPA 4.3% 31.2%
Rhoen Klinikum 2.2% 8.4%
KPN shares 0.6% 0.2%
KPN rights 0.4% -1.0%
     
Short: Focus Media Group -0.9% -8.5%
Short: Prada -1.0% -13.7%
Short Kabel Deutschland -1.0% -5.0%
Short Lyxor Cac40 -1.2% -11.7%
Short Ishares FTSE MIB -2.0% -10.3%
     
Terminverkauf CHF EUR 0.2% 6.4%
     
Cash 16.4%  


Value 42.5%  
Opportunity 47.0%  
Short+ Hedges -5.9%  
Cash 16.4%  
  100.0%

Major changes were: Increase in Perrier to now 3%, sale of Total Produce and WMF pref shares, increase in IVG convertible plus 1% KPN as a new share. For my portfolio, this was a very active month.

Comment: All time highs

A lot of newspaper articles are concerned with the current “all time highs”, both in the DAX and the S&P 500 as well as the Dow Jones. Many people argue that level is of very high significance, either as an upper boundary or support.

In my opinion this is one of the most prominent cases of “Anchoring”, a well documented behavioural finance bias. Yes, the Dax already 2 times bounced back from the 8000 point level, in 2000 and 2007 as this chart clearly shows:

However if you look at the composition of the DAX in those years one can quickly see that the Dax is a very different animal now than in the past.

Those are the Top 5 stocks now:

Weight
BASF SE 9.9%
Bayer AG 9.8%
Siemens AG 9.0%
SAP AG 8.1%
Allianz SE 7.6%

Compare this to the top 5 a mere 5 years ago on December 2007:

Weight
E.ON SE 10.1%
Siemens AG 9.9%
Allianz SE 8.4%
Daimler AG 8.2%
BASF SE 6.2%

Yes, 3 stocks are still in the Top 5 (Allianz, BASF and Siemens) but 2 out of 5 are new and the weights are significantly different.

Even if we compare the top 5 based on their P/Es, we can see that even those shares which remained in the top 5 trade at quite different P/Es:

PE 2007     PE 2013
E.ON SE 15.6   BASF SE 14.6
Siemens AG 26.3   Bayer AG 26.3
Allianz SE 7.5   Siemens AG 14.1
Daimler AG 23.3   SAP AG 25.4
BASF SE 12.4   Allianz SE 10.4

So what does that mean ?

In my opinion, the current absolute level of the DAX compared to the past is totally irrelevant. Any investment decision on such an arbitrary basis is a clear “anchoring bias”. Investment decisions should be made irrespective of index levels. If you find a cheap stock buy it, when a stock is too expensive, sell it. It doesn’t matter where the Index is compared to its past.

March 2013 Performance & comment: “Another storm in the teacup”

Performance:

Performance in March was again very satisfactory, with +2.0% vs. 0.2% in the benchmark (50% Eurostoxx, 30% Dax, 20% DAX). YTD this results in +13.48% against +4.90% BM performance. Since inception (1.1.2011) the score is now 49.6% against 14.4%.

Best performer was Total Produce with +15.6%., followed by Draeger with +12.5%, AS Creation +11.5%, WMF +10% and Tonnelerie with +9.7%. Biggest looser was of course the IVG convertible with -30.6%. This alone cost the protfolio ~1.5% absolute performance. Also, April SA lost ~12% in March.

Nevertheless I am still surprised how well most of the stocks performed, as many of them are nor really cheap any more. But as it is with momentum, it always carries much much longer than one thinks. Nevertheless, one should not indulge in complacency.

Major transactions

As discussed, I added G. Perrier as new stock. I also sold half of the Total Produce position and added to Gronlandsbanken.

Portfolio as of March 31st 2013:

Name Weight Perf. Incl. Div
Hornbach Baumarkt 4.1% 9.8%
AS Creation Tapeten 4.3% 43.6%
WMF VZ 3.7% 76.0%
Tonnellerie Frere Paris 6.5% 96.1%
Vetropack 4.4% 8.9%
Total Produce 3.1% 75.2%
Installux 3.0% 14.9%
Poujoulat 0.9% 4.9%
Dart Group 3.8% 106.4%
Cranswick 5.1% 18.7%
April SA 3.4% 4.3%
SOL Spa 2.5% 14.2%
Gronlandsbanken 2.3% 23.7%
G. Perrier 2.2% 7.7%
     
     
KAS Bank NV 5.0% 30.0%
BUZZI UNICEM SPA-RSP 5.3% 26.3%
SIAS 5.8% 57.4%
Bouygues 2.6% 10.0%
Drägerwerk Genüsse D 11.3% 198.6%
IVG Wandler 3.0% -22.4%
DEPFA LT2 2015 2.6% 51.6%
HT1 Funding 4.7% 54.1%
EMAK SPA 3.8% 16.7%
Rhoen Klinikum 2.3% 10.7%


Short: Focus Media Group -1.0% -10.9%
Short: Prada -1.1% -25.6%
Short Kabel Deutschland -1.0% -4.6%
Short Lyxor Cac40 -1.1% -8.5%
Short Ishares FTSE MIB -1.8% -1.6%
     
Terminverkauf CHF EUR 0.2% 5.8%
     
Tagesgeldkonto 2% 10.6%  


Value 49.1%  
Opportunity 46.3%  
Short+ Hedges -5.9%  
Cash 10.6%  
  100.0%

Dragerwerke is again above the 10% threshold. I will therefore sell ~1.3% asap. Also, I will reduce Total Produce to 0 in the next few days.

March 2013 comment: “Another storm in the teapot”

Following the press, Europe again narrowly escaped Armageddon in March during the”Cyprus situation”. Common knowledge now is that they broke a tabu with bailing in depositors and again, all the banks and Club Med countries are doomed.

Looking at this more realistically, one could argue that this was at first again an economic non-event. Less than 1mn inhabitants, total bailout of around 15 bn EUR. One should not call this peanuts, however compared for instance with the 57 bn the EU spends on agricultural subsidies annualy, it is clear that we are talking about a rounding error here.

Secondly, I am asking myself: What’s wrong when depositors actually share the burden to a certain extent instead of socializing everything on the tax payers ? Someone with more than 100 k EUR in the bank is actually quite rich. According to latest numbers, German households in the west have on average 132 K EUR, Eastern Germans 55 k EUR average net worth, including real estate. So people are freaking out because people with a lot of money are not being bailed out by people with an equal or lower total net worth ?

Why should a bank depositor in general be better protected than an investor in Government bonds in the same country ? Those implicit or explicit guarantees in my opinion are actually one of the root problems in this whole mess. With deposit guarantees, there is no distinction between good and bad banks. actually, managers of bad banks get a free ride and lot of optionality via this subsidized funding. The capital allocation function of the capital market is highly distorted by this kind of guarantee which is by the way free and not charged.

In the medium and long run, bailing in depositors will in my opinion contribute to the financial stability of a financial system because bad banks will have it much harder to blow up their balance sheet and support asset bubbles. Again, I don’t think we are out of the woods with regard to the “EUR crises” but for me the Cyprus depositor bail in is another small step into the right direction.

Despite the many pundits on TV who claim that they know exactly what to do in this situation, in reality know one has a clue. The best strategy in such situations is trial and error. When you are in unchartered waters or in a forrest at night without light, the most stupid thing would be to say: “Let’s go this way and full speed ahead”. What you should do instead is to go slow, test the waters, feel your way through and change directions if you see obstacles directly ahead.

Don’t get me worng though, this is not meant to be a statement that we will see share prises going up further because the EUR problem will be solved soon. There are a lot of risks out there which might or might not priced into the market. All I am saying is that the next “Black swan” or “grey swan” will most likely not come from the EUR mess but from somewhere else.

Performance February 2013 – Filtering out the noise

February performance for the portfolio was again very satisfactory. The portfolio gained 2.5% against 1.4% for the benchmark (50% Eurostoxx, 30% Dax, 20% Dax). YTD the portfolio is up 11.3% against 4.7% for the BM.

Since inception (1.1.2011), the score is now 46.6% for the portfolio against 14.2% for the BM.

Portfolio as of February 28th 2013:

Name Weight Perf. Incl. Div
Hornbach Baumarkt 4.1% 8.3%
AS Creation Tapeten 3.9% 29.6%
WMF VZ 3.5% 60.5%
Tonnellerie Frere Paris 6.0% 79.1%
Vetropack 4.5% 8.1%
Total Produce 5.4% 48.3%
Installux 3.0% 12.1%
Poujoulat 0.9% 6.4%
Dart Group 3.7% 97.5%
Cranswick 5.1% 17.5%
April SA 2.9% 23.3%
SOL Spa 2.4% 8.0%
Gronlandsbanken 1.2% 41.1%
     
KAS Bank NV 5.0% 29.3%
BUZZI UNICEM SPA-RSP 5.8% 33.8%
SIAS 5.6% 51.2%
Bouygues 2.7% 12.5%
Drägerwerk Genüsse D 10.2% 166.4%
IVG Wandler 4.4% 13.8%
DEPFA LT2 2015 2.7% 53.0%
HT1 Funding 4.6% 48.5%
EMAK SPA 4.1% 21.0%
Rhoen Klinikum 2.3% 9.0%


Short: Focus Media Group -0.9% -3.5%
Short: Prada -1.1% -22.0%
Short Kabel Deutschland -1.0% 3.6%
Short Lyxor Cac40 -1.2% -8.2%
Short Ishares FTSE MIB -2.0% -5.4%
     
Terminverkauf CHF EUR 0.2% 6.3%
     
Tagesgeldkonto 2% 11.8%  


Value 46.6%  
Opportunity 47.4%  
Short+ Hedges -5.9%  
Cash 11.8%  
  100.0%

Performance drivers were Tonnelerie (+15%), Buzzi (+13%), Draeger GS (+10%) and Gronlandsbanken (+13%). Underperformers were April (-11%) and SIAS (-6%). I find the Buzzi performance especially interesting, it seems to be that the market has realized that they are much more an international than an Italian stock.

The only notable change in February was the new -1% short position in Kabel Deutschland. Additionally, I trimmed back the Draeger Position, but again it increased above the 10% threshold.

At the moment, a lot of “preliminary” 2012 numbers are coming in but I find it hard to base any decisions on those preliminary numbers. I prefer to wait for the annual report in order to really see how the companies have developed.

Comment: “Filtering out the noise

If you follow the financial media, the world seems to be jump from one life threatening event to another. “Fiscal cliff”, vote in Italy, “the sequester”, speech of Japanese BOJ chief; Bernanke speech etc. etc. The media wants to promote the picture that thw whole world is “walking on a tight rope” and if any one event goes wrong, doom is ensured. As a result, people are “glued” to their TV sets, Bloombergs etc. in order not to miss the one “big event” which will change it all.

In reality, in my opinion this is all bullshit. The world doesn’t stop if Bersani gets elected or Monti or Berlusconi or if Bernanke is changing the order of words in his statements. The big problem with all the “sensational” media reporting is in my opinion that the “average investor” is driven into bad and sometimes fraudulent investments.

In Germany for instance, despite the relatively good economic background, many people are scared to death about financial markets and the inevitable hyper inflation, that they are easy prey for all kind of scams, like the recent “S&K” scandal or schemes like WGF. The basis theme of those scams is always the same: The world is going to end soon and the only way to protect is to buy “real assets” like precious metals or real estate. Many people are so scared that they forget to make even basic due diligence. The same applies to the mad rush of people in large German cities to buy on a highly leveraged basis residential properties at price level where rent doesn’t even cover depreciation.

Often, i try to discuss this with people but they think I am a madman if I tell them that most of my money is in stocks. What the “man on the street” doesn’t seem to notice is that a stock in a solid company is a very “real asset”. And yes, the price may fluctuate but good companies (or cheap companies) will create real value over time no matter what happens.

The other extreme is of course the permanently bullish sell side information stream, but that is a topic for another comment.

But I admit, it is very hard not to be influenced by the constant stream of mainstream media news. Some of the “tricks” I try to handle it (and filter out the noise) are the following:

– follow only blogs of people who have a long term horizon (see blogroll)
– focus on media appearances of proven long term thinkers (Buffet, Chanos)
– actively ignore media appearances of sell side analysts, market timers etc.
– don’t watch Bloomberg television, cnbc etc.
– take time to read investment classics, biographies, economist articles etc.

Performance January 2013 – The importance of being patient

Performance
In December I said the following:

To be honest, I don’t think that the current portfolio has an equal upside potential like in the beginning of last year, mostly due to the lack of really interesting special situation investments. For instance, the upside of athe Draeger Genußschein was much higher when it trades at~2.5 times the pref shares than the current 4.5 times.

Well, I was obviously very wrong on that one. The portfolio gained gained 8.6% in January, the largest single month gain in the 25 months of the portfolio’s history. The Draegerwerke Genußschein alone gained 25%, other top performers were Tonnelerie (+19%), KAS Bank (+17%) and Dart & Cranswick 15% despite the strong Euro.

The outperformance again the Benchmark (4.9% outperformance) can be almost fully explained by the typical January small cap effect which has been covered quite well by Mebane Faber. The German small cap index SDAX for example gained 10% in January.

Portfolio as of January 31st

Name Weight Perf. Incl. Div
Hornbach Baumarkt 4.3% 9.5%
AS Creation Tapeten 4.0% 29.0%
WMF VZ 3.5% 57.0%
Tonnellerie Frere Paris 5.4% 56.2%
Vetropack 4.4% 4.6%
Total Produce 5.8% 55.9%
Installux 2.9% 6.7%
Poujoulat 0.9% 6.4%
Dart Group 3.8% 100.7%
Cranswick 5.1% 12.9%
April SA 3.4% 39.0%
SOL Spa 2.4% 6.8%
Gronlandsbanken 1.1% 24.4%
     
KAS Bank NV 5.1% 27.5%
BUZZI UNICEM SPA-RSP 5.2% 18.9%
SIAS 6.1% 59.5%
Bouygues 2.7% 8.7%
Drägerwerk Genüsse D 10.6% 142.9%
IVG Wandler 4.5% 13.7%
DEPFA LT2 2015 2.8% 56.6%
HT1 Funding 4.6% 44.9%
EMAK SPA 4.2% 23.1%
Rhoen Klinikum 2.2% 3.0%


Short: Focus Media Group -0.9% -2.7%
Short: Prada -1.0% -10.8%
     
Short Lyxor Cac40 -1.2% -8.5%
Short Ishares FTSE MIB -2.2% -13.7%
     
Terminverkauf CHF EUR 0.3% 7.4%
     
Tagesgeldkonto 2% 10.0%  


Value 47.0%  
Opportunity 48.1%  
Short+ Hedges -5.1%  
Cash 10.0%  
  100.0%

The only change to year-end is Sol Spa which was bought in the beginning of January. Cash is now exactly at my target level of 10%. that means any addition will trigger automatically a sale of another position.

Comment: The importance of being patient

A few days ago, the longterm value blog had a great post about patience in investing.

He mentions one of the cardinal sins in current markets:

I’m writing this, of course, to focus myself. One of the hardest things to do is…. to do nothing. The instinctive reaction to a rising market is to pile on, add shares, up your leverage. But really that’s the absolute worst thing you can do. Don’t kid yourself.

Clearly, jumping into the market because you missed out the rally, especially in risky “high beta” stocks will most likely end in tears.

However another potentially big mistake should also not be underestimated: Taking profits too early. Most investors (including myself) get nervous if their stocks climb quickly 20-30%. What you then often hear is something like “It never hurts taking a profit” or “No one ever got bankrupt by taking a profit” or something similar.

The truth is: In order to generate above average returns, taking profits too early hurts badly. Statistically, the vast majority of investment ideas will be rather average, some will be bad, but some of them and usually only a small amount will be really really succesful.

If I look at my portfolio, most the outperfomance of ~23% over the last 25 months can be attributed to only a few positions especially Draegerwerk, Aire KgAa, Dart Group which have all doubled.

In all cases, it was and is always tempting to sell out and “take the profit” quickly. For Draegerwerk and Aire, I started selling too early, however I was lucky to start only with small amounts. Looking back over my 25 year investment “carreer”, I made many mistakes. However the most costly ones in the end were selling companies like Fuchs, Rational or Fielmann much to early.

Fuchs AG Vz. for example was one of the stocks I bought during the 2008/2009 around 12 EUR (adjusted for the split) and happily took the profit end of 2009 at 20 EUR, feeling like an investment genius. However, with the stock now at 58 EUR (plus a few Euros dividends in between), it looks pretty stupid. I knew that Fuchs was an outstanding company. Even worse, if I would have kept those shares the gains would have been tax free as they would have not been subject to the “Abgeltungssteuer” introduced in January 2009.

So looking back, “taking the profit” on a share like Fuchs (much) too early was maybe one of the biggest and most expensive mistakes in my investment career.

2012 Performance review and comments

Performance

2012 was a very good year for the blog portfolio. Overall performance 2012 including dividends and interest) was 37,4% vs 26.6 % for the Benchmark (50% Eurostoxx, 30% DAX, 20% MDAX), resulting in a relative outperformance of 10.4% for the year 2012.

Further details can be found in the following table:

Bench Portfolio Perf BM Perf. Portf. Portf-BM
2010 6,394 100      
2011 5,510 95.95 -13.8% -4.1% 9.8%
           
Jan 12 5,972 99.27 8.4% 3.5% -4.9%
Feb 12 6,275 105.90 5.1% 6.7% 1.6%
Mrz 12 6,330 107.22 0.9% 1.2% 0.4%
Apr 12 6,168 108.02 0.8% -2.6% -3.3%
Mai 12 5,750 108.90 -6.8% 0.8% 7.5%
Jun 12 5,969 110.17 3.8% 1.2% -2.6%
Jul 12 6,229 112.15 4.4% 1.8% -2.6%
Aug 12 6,428 119.48 3.2% 6.5% 3.3%
Sep 12 6,510 123.48 1.3% 3.3% 2.1%
Okt 12 6,672 125.32 2.5% 1.5% -1.0%
Nov 12 6,804 127.04 2.0% 1.4% -0.6%
Dez 12 6,973 131.81 2.5% 3.8% 1.3%
           
           
YTD 12 6,973 131.81 26.6% 37.4% 10.8%
           
Since inception 6,973 131.81 9.1% 31.8% 22.7%

The December 2012 outperformance is mainly a result of some significant year-end effects in some of the stocks like Total Produce, SIAS and Buzzi to name a few.

Also many of the stocks are rather “boring” low beta stocks. Therefore the 2012 outperformance should be viewed more as lucky timing of special situations than anything else. In a normal “bull year” like 2012 the portfolio should significantly underperform. In 2012 however, some of the special situations (esp. AIRE KgAA and Draegerwerke) catalysed unexpectedly early and let to this outperformance. From an overall strategy point of view, i would assume that my portfolio outperforms in bad years and underperforms in bull years.

To be honest, I don’t think that the current portfolio has an equal upside potential like in the beginning of last year, mostly due to the lack of really interesting special situation investments. For instance, the upside of athe Draeger Genußschein was much higher when it trades at ~2.5 times the pref shares than the current 4.5 times. On the other hand, I think the portfolio is well protected to the downside which should be the major concern of any (real) value investor.

Portfolio:

The only change in the portfolio in December was the purchase of some Sol Spa shares in the last few days, taking advantage of the significantly dropping share price.

Name Weight Perf. Incl. Div
Hornbach Baumarkt 4.5% 6.9%
AS Creation Tapeten 4.1% 22.2%
BUZZI UNICEM SPA-RSP 5.5% 16.0%
WMF VZ 3.4% 42.6%
Tonnellerie Frere Paris 4.9% 31.5%
Vetropack 4.5% -2.3%
Total Produce 6.2% 53.3%
SIAS 6.3% 52.6%
Installux 2.9% -1.6%
Poujoulat 0.9% -2.8%
Dart Group 3.8% 83.7%
Cranswick 5.0% 2.7%
April SA 3.5% 33.0%
Bouygues 3.1% 15.2%
KAS Bank NV 4.7% 9.6%
Gronlandsbanken 1.2% 19.5%
SOL Spa 1.7% -0.7%
     
Drägerwerk Genüsse D 9.2% 96.5%
IVG Wandler 4.9% 11.6%
DEPFA LT2 2015 3.0% 52.6%
HT1 Funding 4.7% 38.4%
EMAK SPA 4.4% 17.6%
Rhoen Klinikum 2.4% 2.4%
     
Short: Focus Media Group -1.0% -3.7%
Short: Prada -1.2% -17.3%
     
Short Lyxor Cac40 -1.3% -5.7%
Short Ishares FTSE MIB -2.2% -7.5%
     
Terminverkauf CHF EUR 0.2% 5.0%
     
Tagesgeldkonto 2% 10.7%  


Value 63.4%  
Opportunity 28.6%  
Short+ Hedges -5.5%  
Cash 10.7%  
  97.2%

The cash quota of ~10% is within my usual target range.

Outlook and comments:

If I would be in the “tactical” Asset allocation business, I would expect a rather strong start into the new year.(Edit: Is started writing this 2 days ago…) So many investors have watched the stock market from the outside and momentum looks quite strong. It looks like the fear of missing out another strong year is overcoming the fear of Euro crisis, fiscal cliff etc. or to quote Howard Marks: “when greed is stronger than fear”.

On the other hand, as a bottom up value investor one should be more cautious than ever. When greed is trumping fear, naturally for a value investor times get harder as under valuations are fewer and harder to find. The temptation rises to invest in “weak” stocks or turnarounds without much downside protection.

This goes together with the behavioural bias of “overconfidence” which usually is getting stronger after good years.

So the main focus for value investors will be to “stay the course” and not get lured into more risky and only superficially “cheap” stocks despite another period of potential underperformance against major stock indices.

The “harvest” will come when everyone is “on board” in the stock market and the next (inevitable) correction or contraction will come.

Performance November 2012 & Comments

November was a quite good month in the end for the market despite a short slump by the mid of the month. The Benchmark (50% Eurostoxx, 30% Dax, 20% MDAX) made 2.0% for the month against 1.4% for the portfolio. Again, this is something I would expect in a normal “up month”.

Best performer was clearly Dart Group with ~+33% in November and Total Produce with +9.3%, underperformers were mainly Kas Bank (-7.1%), Emak (-8%) and April (-7%).

YTD the portfolio is now up 32.4% against 23.5% for the BM.

Bench Portfolio Perf BM Perf. Portf. Portf-BM
2010 6,394 100      
2011 5,510 95.95 -13.8% -4.1% 9.8%
           
Jan 12 5,972 99.27 8.4% 3.5% -4.9%
Feb 12 6,275 105.90 5.1% 6.7% 1.6%
Mrz 12 6,330 107.22 0.9% 1.2% 0.4%
Apr 12 6,168 108.02 0.8% -2.6% -3.3%
Mai 12 5,750 108.90 -6.8% 0.8% 7.5%
Jun 12 5,969 110.17 3.8% 1.2% -2.6%
Jul 12 6,229 112.15 4.4% 1.8% -2.6%
Aug 12 6,428 119.48 3.2% 6.5% 3.3%
Sep 12 6,510 123.48 1.3% 3.3% 2.1%
Okt 12 6,672 125.32 2.5% 1.5% -1.0%
Nov 12 6,804 127.04 2.0% 1.4% -0.6%
           
YTD 12 6,804 127 23.5% 32.4% 8.9%
           
Since inception 6,804 127.04 6.4% 27.0% 20.6%

The composition of the portfolio looks as follows:

Name Weight Perf. Incl. Div
Hornbach Baumarkt 4.5% 1.7%
AS Creation Tapeten 4.2% 20.9%
BUZZI UNICEM SPA-RSP 5.2% 6.5%
WMF VZ 3.6% 45.5%
Tonnellerie Frere Paris 4.8% 25.1%
Vetropack 4.6% -4.3%
Total Produce 5.8% 38.2%
SIAS 6.1% 43.5%
Installux 3.2% 3.9%
Poujoulat 1.0% -2.7%
Dart Group 3.6% 68.0%
Cranswick 5.0% -0.8%
April SA 3.1% 12.4%
Bouygues 2.7% -1.3%
KAS Bank NV 4.7% 4.8%
Gronlandsbanken 1.1% 5.2%
     
Drägerwerk Genüsse D 9.7% 99.3%
IVG Wandler 4.9% 8.7%
DEPFA LT2 2015 3.0% 49.1%
HT1 Funding 4.8% 35.6%
EMAK SPA 4.5% 17.1%
Rhoen Klinikum 2.5% 4.2%
     
Short: Focus Media Group -1.0% -0.4%
Short: Prada -1.1% -7.1%
     
Short Lyxor Cac40 -1.3% -4.3%
Short Ishares FTSE MIB -2.2% -4.9%
     
Terminverkauf CHF EUR 0.2% 4.8%
     
Tagesgeldkonto 2% 12.8%  


Value 62.1%  
Opportunity 29.5%  
Short+ Hedges -5.4%  
Cash 12.8%  
  98.9%

As discussed, I took a first 1% stake in Gronlandsbanken and slightly increased the Installux and Poujoulat positions under the usual rules.

Comment & Outlook

December is always the month for predictions for the next year. In my opinion, those predictions should be viewed as entertainment rather than a serious effort. No one knows what’s going to happen, so it’s best to stay prepared for any outcome.

However one thing I can predict with absolute certainty: The popular trailing 10 year average returns for stocks will dramatically increase. The arithmetic is relatively easy:

From the beginning of 2002 to the end of 2011, for instance the DAX earned a meager 1.35% annually. Much less than bonds. Next year however, the 10 year average will exclude 2002 but include 2011. 2002 was a very bad year (-44%), 2012 seems to be a quite good year (YTD +26.6%).

So this small statistical change results in a sudden jump to an annualised 10 year yield of 9.94% for the DAX !!! So all this talk of the “lost” decade for stocks suddenly will move into a “stocks performed great over the last decade”.

I don’t know what that means for the stock market (most likely nothing), but it shows that many of “common known truths” like “the lost decade for stocks” are in fact nonsense and/or (Bond) marketing slogans.

Edit: Starting next year I will switch to quarterly reviewss as the monthly review is somehow not so interesting for a longer term oriented portfolio.

Performance October 2012 & Comments

Performance
October has been a “normal” month for the portfolio. The Benchmark (Eurostoxx 50%, Dax 30%, MDAX 20%) gained 2.5%, whereas the portfolio “only” gained 1.5%. Year to date, The portfolio now shows a gain of +30.6% against 21.1% for the Benchmark. Since inception(1.1.2011), the portfolio is up by 25.3% against 4.4% for the benchmark.

Main performance drivers in October have been Dart Group (+15.1%), AS Creation (+11.8%), HT1 (+7.5%). Main “detractors” were Cranswick (-5.1%), Vetropack (-4.9%), Bouygues (-2.2%) and Rhoen (-2.1%)

Just for fun, I calculated the Sharpe ratio based on the 22 available monthly returns, both for the portfolio and the benchmark. The sharp ratio for the Benchmark is 0.2, however for the portfolio it is an incredible 0.90. I don’t think that I will manage such Sharpe ratios over the long run but it is still interesting to see.

Portfolio as of 31.10.2012:

Name Weight Perf. Incl. Div
Hornbach Baumarkt 4.7% 5.1%
AS Creation Tapeten 4.3% 21.6%
BUZZI UNICEM SPA-RSP 5.1% 1.4%
WMF VZ 3.8% 49.4%
Tonnellerie Frere Paris 5.0% 25.4%
Vetropack 4.5% -7.6%
Total Produce 5.3% 26.8%
SIAS 6.0% 39.4%
Installux 3.0% -0.1%
Poujoulat 0.8% -4.6%
Dart Group 2.8% 28.2%
Cranswick 4.8% -6.4%
April SA 3.4% 20.9%
Bouygues 2.4% -4.5%
KAS Bank NV 5.1% 12.6%
     
Drägerwerk Genüsse D 10.1% 104.6%
IVG Wandler 3.5% 9.5%
DEPFA LT2 2015 3.0% 45.1%
HT1 Funding 4.6% 29.4%
EMAK SPA 5.0% 26.9%
Rhoen Klinikum 2.5% 0.5%
     
Short: Focus Media Group -1.0% 2.4%
Short: Prada -1.1% -6.1%
     
Short Lyxor Cac40 -1.3% -0.5%
Short Ishares FTSE MIB -2.2% -2.9%
     
Terminverkauf CHF EUR 0.2% 4.9%
     
Tagesgeldkonto 2% 15.9%  


Value 60.9%  
Opportunity 28.7%  
Short+ Hedges -5.4%  
Cash 15.9%  
  100.0%

Following the “autumn cleanup” post, I have already sold down all the “low conviction” positions, as the two last days of the month were “up days”. I increased only IVG and Rhoen so far.

In detail, the following positions were closed:

EVN, total return -4.87%
Mapfre +44.75%
Short Kabel Deutschland -52.87%
OMV -3.92%
Fortum -24.17%

Apart from the hedges, the portfolio has now 23 “single names” which is something I consider within the optimal range considering the amount of time I can spend on the portfolio.

The other announced position increases will be executed in November and as a general rule only on “down days”.

Comment & Outlook

One fascinating aspect of the current stock market is in my opinion the obsession of many money managers with the US Fed and the ECB and low interest rates in particular. Just as an example, one could read for instance the latest publication from Steve Romick (FPA) which argues quite strongly against the current policy of Fed Chairman Ben Bernanke.

The argument more or less goes as follows: The low interest rates inflate asset prices (Bonds, real estate, stocks) which distorts capital allocation and will in the medium to long run create even bigger problems than today’s problems.

I have to admit that I can only partly follow this logic. It is true, that interest rates are relatively low and maybe artificially so for certain segments. On the other hand we see a lot of deflationary developments for instance within the Euro zone.

However, I find it strange that many people relate the level of the stock market directly and exclusevily to the interest rate level. Interest rates are one of many factors in valuing stocks. Although many people make their living in trying to explain on CNBC or Bloomberg why the stock market has moved up or down, obviously no one knows the reasons, otherwise they all would be rich and counting their money from successfully predicting the market.

Many people seem to think that stocks should be cheaper because of “macro uncertainty”, although in my opnion this is wrong. There is always macro uncertainty, for me it seems that only the majority of commentators seems to forget about that sometimes.

Going back to Steve Romick: I guess his commentary might have something to do with the recent underperformance of his flagship fund which has missed out a significant part of the rally. Although I really like those guys, this comment sounds a little bit like a lame excuse to blame the “market bubble” for the underperformance.

So to make it short: In my opinion one should either ignore all those commentators which try to explain why the market is over- or undervalued based on macro factors or consider them as “entertainment”. Uncertainty and central bank intervention are part of the market since many many decades. For all those pundits who think that a “free” capital market without central banking is the answer, I would highly recommend to read some history books how markets and banks behaved BEFORE central banking had been established.

Performance September 2012 & Comments

Again, September has been a surpisingly strong month against the Benchmark. The Benchmarl (50% Eurostoxx, 30% Dax and 20% MDAX) gained +1.3% resulting in a YTD perfromacne of 18.2%. The portfolio returned however +3.3% in September, resulting in a YTD performance of 28.7% or 10% better than the benchmark.

Full performance overview:

  Bench Portfolio Perf BM Perf. Portf. Portf-BM
2010 6,394 100      
2011 5,510 95.95 -13.8% -4.1% 9.8%
           
Jan 12 5,972 99.27 8.4% 3.5% -4.9%
Feb 12 6,275 105.90 5.1% 6.7% 1.6%
Mrz 12 6,330 107.22 0.9% 1.2% 0.4%
Apr 12 6,168 108.02 0.8% -2.6% -3.3%
Mai 12 5,750 108.90 -6.8% 0.8% 7.5%
Jun 12 5,969 110.17 3.8% 1.2% -2.6%
Jul 12 6,229 112.15 4.4% 1.8% -2.6%
Aug 12 6,428 119.48 3.2% 6.5% 3.3%
Sep 12 6,510 123.48 1.3% 3.3% 2.1%
           
YTD 12 6,510 123.48 18.2% 28.7% 10.5%
           
Since inception 6,510 123.48 1.8% 23.5% 21.7%

Top performers in September were Total Produce, SIAS, Buzzi and KAS Bank, although most of the positions were positive.

There were no big changes to the portfolio apart from the two new shorts (Prada, Focus Media) and the 1% Rhoen Position. Piquadro has been completely sold down. As discussed https://valueandopportunity.com/2012/06/18/cranswick-plc-isin-gb0002318888-business-model-and-valuation/#comment-3106, Cranswick has been “upgraded” to a full position.

Portfolio as of Sep. 30th 2012:

Name Weight Perf. Incl. Div
Hornbach Baumarkt 4.6% 2.6%
Fortum OYJ 3.4% -23.8%
AS Creation Tapeten 3.9% 9.5%
BUZZI UNICEM SPA-RSP 4.9% -2.4%
EVN 2.7% -5.5%
WMF VZ 3.9% 51.2%
Tonnellerie Frere Paris 5.1% 27.0%
Vetropack 4.8% -3.1%
Total Produce 5.5% 28.1%
OMV AG 2.1% -6.2%
SIAS 6.0% 35.8%
Installux 2.9% 1.4%
Poujoulat 0.7% 10.2%
Dart Group 2.5% 12.6%
Cranswick 5.2% -0.4%
April SA 3.3% 15.3%
Mapfre 0.7% 44.2%
KAS Bank NV 5.2% 12.6%
     
Drägerwerk Genüsse D 9.7% 94.0%
IVG Wandler 2.1% 13.4%
DEPFA LT2 2015 2.9% 39.2%
HT1 Funding 4.4% 21.1%
EMAK SPA 5.0% 26.3%
Rhoen Klinikum 1.0% 4.0%
     
Short: Kabel Deutschland -2.2% -52.2%
Short: Focus Media Group -1.0% 2.4%
Short: Prada -1.0% 1.7%
     
     
Short Ishares FTSE MIB -2.3% -3.0%
Terminverkauf CHF EUR 0.2% 5.1%
     
Tagesgeldkonto 2% 13.9%  
     
Summe 100.0%  
     
Value 67.4%  
Opportunity 25.1%  
Short -6.3%  
Cash 13.9%  
  100.0%  

Comments:

The portfolio now has a certain “tilt” towards the Euro crisis.  Although the direct percentage of PIIGS is only around 18%, a couple of the other positions (HT1, IVG, April) do show correlation with the developement in the Eurozone. 

I do not have a problem with this as I think all those stocks are cheap based on “bottom of the cycle” valuations. As indicated in my “boss Score” posts, I will prioritize to a certain extent French stocks going forward, as I find them exceptionally cheap as well.

Regarding the macro picture, I have nothing new to add.  BRIC’s look relatively weak if you look through the hype and the US is not doing that well either. So I find no reason to go “hunting” for value outside Europe for the time being.

Cash is  with 13.9% still comfortably high, I could add one position and still maintain my minimum threshold of 10%.

All in all I try to prepare myself for some months of underperformance as the current status seems to be “too good to be true”.  Past experience  however shows that such “hated rallys” have really long legs and it usually doesn’t pay to time the market.

« Older Entries Recent Entries »