Free cashflow reporting: Doing it “Grenke style” (Grenke, Silver Chef)
After my post about Australian Leasing companies a few days ago, I decided to start with Silver Chef, a company I found interesting.
Negative Free cash flow at Silver Chef
As many other value investors have, I have incorporated the concept of Free Cash flow into my investment process. A company which produces great earnings but no free cash flow is often a big red flag (see for instance the Globo Plc case)
So a first look at Silver Chef seems to indicate that they have a big problem. Great earnings but negative free cash flows and increasingly so:
| Silver Chef | ||
|---|---|---|
| EPS | Free CF/Share | |
| 31.12.2004 | 0,09 | -1,27 |
| 30.12.2005 | 0,15 | -1,27 |
| 29.12.2006 | 0,11 | -0,72 |
| 31.12.2007 | 0,16 | -0,45 |
| 31.12.2008 | 0,21 | -1,19 |
| 31.12.2009 | 0,26 | -0,77 |
| 31.12.2010 | 0,29 | -1,02 |
| 30.12.2011 | 0,37 | -1,57 |
| 31.12.2012 | 0,41 | -1,83 |
| 31.12.2013 | 0,43 | -1,69 |
| 31.12.2014 | 0,51 | -2,68 |
However, for a typical financial servives company with strong growth, this is not unusual. If you are in the business of renting out or leasing equipment to someone, you have to buy it first and get paid back later over time. This is why it is called “financing” and why free cashflows are only signifcantly positive if you are stable or shrinking.
Free Cashflow “Grenke style”
As I mentioned in the last post, Grenke so far has been my “Gold Standard” for Leasing companies, so let’s look how Free Cash flow looks like at Grenke:
| Grenke | ||
|---|---|---|
| EPS | Free CF/Share | |
| 31.12.2004 | 1,74 | 2,14 |
| 30.12.2005 | 2,13 | 0,81 |
| 29.12.2006 | 2,23 | 2,55 |
| 31.12.2007 | 2,35 | 2,28 |
| 31.12.2008 | 2,42 | #N/A N/A |
| 31.12.2009 | 1,80 | 4,77 |
| 31.12.2010 | 2,03 | 2,93 |
| 30.12.2011 | 2,87 | 0,56 |
| 31.12.2012 | 3,10 | 2,63 |
| 31.12.2013 | 3,23 | 5,45 |
| 31.12.2014 | 4,41 | 4,64 |
I was actually flabbergasted (sorry, I always wanted to use this word at least once) when I saw those numbers. Grenke grows strongly but actually manages to produce Free Cash flows higher than earnings.
For a leasing company, this is actually an extraordinary achievement. So I decided to look into Grenke’s 2015 annual report first.
This is the Cashflow statement and I circeled the interesting parts:
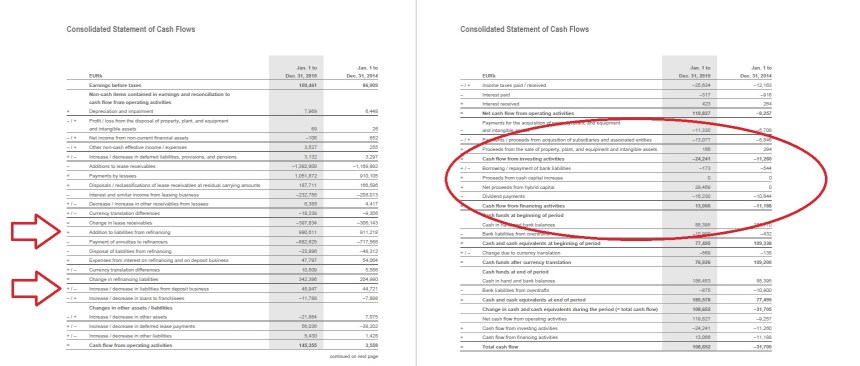
When I look into a balance sheet, I always do one very simple check: I look at how financial liabilities developed over the last year and check this against the financing cash flow.
In Grenke’s case we can read from the balance sheet, that financial liabilities have increased overall by around 400 mn EUR, however financing cashflow is only +13 mn. How can that be ?
The solution is found in the Operating cashflow part: Grenke actually reports the increase in borrowing as operating cash flow. Just out of interest I checked different leasing companies such as Sixt Leasing, Aercap and a few others and Grenke is the only one doing so.
What are the implications of this ?
The implidation of this is very easy: Grenke’s reported cashflows are absolutely meaningless. If you include borrowing into operating cashflow, you can create any free cash flow number you like just by borrowing some more money. This is not the meaning of Free Cash flow.
If you read the actual IFRS rules (IFRS 7 Cash flow), it is pretty clear that Grenke’s way of cash flow reporting is “unique”. Those are the relevant sections:
Operating activities are the principal revenue-producing activities of the entity and other activities that are not investing or financing activities. Cash flows from operating activities are primarily derived from the principalrevenue-producing activities of the entity.
and
Financing activities are activities thatresult in changes in the size and composition of the contributed equityand borrowings of the entity. The separate disclosure of cash flows arising from financing activities is important because it is useful in predicting claims on future cash flows by providers of capital to the entity.
I have double checked, Grenke is reporting in this way since 2000 (this was the oldest annual report available), so at least they do it consistently.
How would Grenke look with “normal” Cash Flow reporting ?
This is a quick restatement how Grenkes cashflow statement would look like if they would report as all the other leasing companies do:
| Grenke 2015 as reported | |
|---|---|
| OP CF | 119,8 |
| – thereof increase lease assets | -397,0 |
| – thereof increase in borrowing | 391,0 |
| Investment cashflow | -24,2 |
| Financing cashflow | 13,0 |
| Total cash flow | 108,6 |
| Free cash fflow | 95,6 |
| FCF/Share | 6,6 |
| Grenke 2015 according to IFRS | |
| Operating CF | 119,8 |
| minus proceeds from borrowing | -391,0 |
| plus increase in lease assets | 397,0 |
| Operating cashflow restated | 125,8 |
| Investing CF | -24,2 |
| minus cash out for lease assets | -397,0 |
| total investing Cashflow restated | -421,2 |
| Financing cashflow | 13,0 |
| plus increase in borrowing | 391,0 |
| Total financing cashflow restated | 404,0 |
| Total cash flow | 108,6 |
| Free cash flow restated | -295,4 |
| FCF/Share restated | -20,0 |
Overall cash flow stays the same, but Free Cash per share flow changes daramatically from +6,6 EUJR per dhare to -20,0 EUR per share. And suddenly Grenke looks much more similar to Silver Chef.
Just for fun we can use Silver Chef’s stated CF statement and redo it “Grenke style”:
| Silver Chef 2015 as stated | |
|---|---|
| Operating CF | 103,3 |
| Investing CF | -135,8 |
| Thereof increase in leasing assets | -135,8 |
| Financing CF | 32,6 |
| Thereof increase in borrowing | 32 |
| Total CF | 0,1 |
| Free CF | -32,5 |
| Free CF per share | -0,92 |
| Silver Chef “Grenke style” | |
| Operating cash flow stated | 103,3 |
| minus leasing asset increase | -135,8 |
| plus increasem in boorowing | 32 |
| Operating CF restated | -0,5 |
| Investing CF | -135,8 |
| plus increase in lease assets | 135,8 |
| Investing CF restated | 0 |
| Financing CF | 32,6 |
| minus increase in borrowing | -32 |
| Financing CF restated | 0,6 |
| Total CF | 0,1 |
| Free CF | -0,5 |
| Free CF per share | -0,01 |
What a mircale, suddenly the negative free cash flow turns into a flat cashflow. Why is it not positive ? Is Grenke still better ? The answer is no, Grenke just borrowed more (around 100% of increase in leased assets) . Silver Chef actually funded most of their investment out of equity. Adjusted for that, Silver Chef is much more Cash generative than Grenke.
Summary: Does it matter if Grenke is doing it “Grenke style” ?
For me what matters most is that if I compare Grenke to another leasing companies, one needs to be aware that Grenke’s cashflow should be either ignored or better restated in orther to get a clear picture and a good comparison.
I think however the example of Grenke leads two 2 very important lessons:
- Don’t rely on stated cash flow numbers. Many investors look at cashflows as the “Truest form” of eanrings. But the Grenke example clearly shows that IFRS seems to allow some pretty significant “modifications” which might make those cashflow numbers almost meaningless. I am surprised that they actually got sign off on that.
- As a Grenke investor I would ask myself: Why are they doing it ? I have no answer on that and I don’t plan to digg deeper into Grenke, but if any of my reader has better accounting knowledge, I would be interested why auditors sign of such a cashflow statement.
Just to be clear here: I am not saying that Grenke is doing something wrong here, I don’t know the IFRS rules good enough if this practice is allowed. All I am saying is that Grenke is reporting Cashflow differently than any competitor but in a way that makes the cashflow statement look better but completely meaningless.

sorry forget previous comment. Sales type lease.
please take a look at grenke note 3.4 Profit from new business in Annual Report 2015. Are you familiar with this accounting treatment? I am also not familiar with IFRS.
I was just about to perform this analysis – literally comparing Silver Chef to Grenke. He’s saved me so much time. My only concern now is, that using the correct FCF /share figures for Grenke, is Grenke massively overvalued? The best assessment would be a five-year accurate FCF vs EPS comparison, which on average should be >75%. Whatever the percentage is, should be applied to the EPS part of the PE multiple to determine an adjusted PE should be.
I don’t think that Free Cashflow is a very useful concept for financial companies. As for Grenke, I do think that current Prices imply significant growth, so they better deliver on that…..
Great article, always good to read your analysis around cash flow statements!
may be minor in terms of total financing but its at zero cost to them. Plus secures their bad debts as often its around 20% from memory or so of asset and then as they take payments weekly, if customer is not paying after few weeks they can often get back the machine and deposit is a buffer. have an old presentation am happy to send you if you want
Agreed, it is definitely a very good feature of their business model and also a good risk management tool. Always happy to look at any presentations.
used to be a shareholder of SilverChef, really a good cash generative business but unfortunately sold it too early 😦 now it looks a tad expensive but business model is very good. One thing to note with it is the rent try buy scheme takes a relatively large upfront deposit (liability) for the equipmnt which is akin to a buffett style free float and sits on their balance sheet. they get financing from this almost better than debt and equity!!
JT,
thanks for the comment, there will be a post on Silvber Chef soon. With regard to the float: This is actually a minor position for them, maybe 15% of the toal funding.
hmm, for someone who does this regularily, it could be interesting. For me personally, I don’t think so….
Perhaps room to for a long-short pair trade in that case, with Grenke on the short end of the equation?