Happy Holidays !!!
Enjoy the holidays. Find below one of my favourite Christmas songs:
Enjoy the holidays. Find below one of my favourite Christmas songs:
December is always a good time to look at the portfolio and revisit the initial investment case in order to decide if all the investments are still “on track”. I did sort out a few already some weeks ago, so this is kind of “double checking” on the ones I decided to keep.
Warning: Almost all of my 24 positions are pretty boring. So anyone looking for “hot tips” might skip this post. As most reader might know, I prefer rather “boring” stocks. In order add a little excitment, I added the company logos this time….. 😉
Before jumping into the stocks, looking back at last year’s 22 for 2013, 14 of last year’s selection are still “in”. This is in line with my goal to have an average holding period of at least 2-3 years for the normal value stocks. The number of stocks has grown by 2 but this is well within my range of 20-30 positions I am targeting. I am not a big fan of extremely concentrated portfolios.
1. Hornbach Baumarkt

A stock which is in the portfolio since the beginning. Had to fight several headwinds in 2013 like bad weather in the all important first half-year, a (now bankrupt) competitor who was selling for cash flow (Praktiker) and of course the internet. Nevertheless in my opinion a very good, ultra solid long-term holding. Could surprise to the upside next year.
2. Miko BV
Plastics packaging and Coffee distribution. Strange combination, but again ultra solid and cheap stock with relatively good growth over the years. Could surprise to the upside because of lower input costs (Coffee.
3. TFF Group (formerly Tonnellerie Francois Freres)
Despite the good performance still a very attractive French stock. Typical, family run solid and long-term oriented business. As one of the biggest Oak barrel manufacturers, TFF did clearly profit from rich people in BRIC countries buying expensive French wines and Whisky. They did take over the number 2 producer Radoux some time ago and seem to harvest the benefits now. A “luxury stock in hiding” so to say.
4. Vetropack
![]()
Swiss based, ultra solid producer of glass bottles. Currently struggling both, with high energy prices and low growth in some of its main markets, esp. Eastern Europe. Nevertheless a solid position. Some potential upside via a new thinner but equally solid type of glass bottle which might even replace PET bottles.
5. Installux
![]()
Very cheap and unspectacular French aluminium parts manufacturer with large cash pile. Surprisingly resilient business despite the weak home market. More like a “deep value” stock. 4.3% dividend yield.
6. Poujoulat
Another unspectacular French small cap, specialist for chimneys of all sorts. Large top line growth via entrance into wood pellet business, however large depreciation reduced overall margins. If margins recover, stock could have a lot of upside.
7. Cranswick
UK-based “pork centric” food group. Again, nothing spectacular but very solid performance. Still cheap compared to the quality of the business
8. April SA
French based insurance broker / specialist insurer. Currently struggling with French health care regulation. Nevertheless still one of the most attractive business models for financials.
9. Sol Spa
![]()
Technical gases and healthcare related gas business. Very well run, good growth in the Healthcare sector. True strength not shown in the numbers due to large upfront write-offs. Long term holding.
10. Gronlandsbanken
Basically only bank in Greenland with high margins and good return. Potential upside if rare earth mining projects and other natural resources projects get started. Potential “Global warming” beneficiary. 8.3% dividend yield makes waiting easy.
11. G. Perrier

Interesting French specialist for electrical installations. Growing business especially in the nuclear power area. Barriers for competitors due to certification requirements.
12. IGE & XAO
French based software specialist for electrical CAD. Quasi monopoly in France. Good margins and good growth plus large cash pile. Shareholder structure might make some “corporate action” possible.
13. Thermador
Very interesting French home building and improvement supplier company . Unique “outsider style” business model and corporate culture. Currently struggling a little due to low domestic French demand but very good company at an attractive price. 4.6% dividend yield.
14. Trilogiq
French production optimisation company. Based on Japanese production philosophy, company provides solution and know how to optimise production. Active mostly in the car industry. Net cash, good margins and still cheap.
15. Van Lanshot
![]()
One of the leading Dutch Private banks. Did make some strategic mistakes in the past. Now with CEO trying to focus on “traditional” private banking. If turnaround is succesful and “normal” private banking margins can be achieved, stock has good potential. Additional tailwind because of tax crack down on Swiss private banks.
16. TGS Nopec
Seismic data company with an “outsider style” business model. Doesn’t own ships, was very disciplined in “Underwriting” explorations in the past. Currently more competition from struggling “traditional” competitors with ships and oil companies. If business stays “normal” significant upside. 5.6% dividend yield and share buybacks.
17. KAS Bank
Dutch bank, specialising in securities services. Due to low-interest rates, profitability under pressure. Will benefit if short-term rates start to rise. In the meantime, 6.7% dividend yield “sweetens” the wait.
18. SIAS SpA
Italian toll road operator. Very cheap infrastructure asset, “under leveraged”. Paid large special dividend but also reinvested in additional toll roads. If traffic in Italy stabilizes, stock has good upside.
19. Draegerwerk Genußscheine
Capital structure arbitrage. One Genußschein is equal to 10 preference shares but trades only at a multiple of 4-5 times. Patience required.
20. Depfa LT2 2015
![]()
Lower tier 2 bond of nationalised Depfa bank. At the current price solid 7% expected return p.a. until maturity 2015 with relatively low risk.
21. Commerzbank HT1 Funding
Tier 1 Commerzbank bond with a twist: Coupon is guaranteed by a third-party. At the current yield level of around 7% still a good “hold” until I have better ideas.
22. Rhoen Klinikum
I bought the stock after the first failed take over attempt. Now it looks like that the sale of the majority of the business to Fresenius will be cleared. To be sold if my price target of EUR 22.50 is hit.
23. MAN SE
Another special situation, betting on Volkswagen having to pay more than the 83 EUR compensation initially proposed after implementing a profit and loss transfer agreement.
24. Celesio stock /Convertible 2018
Newest addition to the portfolio. Speculation that acquirer Mckesson will have to pay more than the 23 EUR offer due to Elliott (Paul Singer) blocking position.
Current Watchlist:
1. Valmet, Metso Spin off January 2014
2. Portugal Telecom: Merger with Brazilian OI in 2014
3. Maisons France: Potential “outsider style” company in tough market.
DISCLAIMER: The securities discussed in this post are very risky and the author might have already bought some before publishing the post. The overall situation is tricky and not really recommended for “normal” investors due to the involvement of some well known capital market “sharks”.
Celesio, the German pharmaceutical wholesaler has received a takeover offer a few days ago from US giant McKEsson at 23 EUR per share under the condition that at least 75% of shareholders will tender their shares
A few facts/background:
– majority owner Haniel (also largest shareholder of Metro) needs money and committed to tender their controlling block of 50.01% for around 2 bn
– in the meantime however Elliott, the US Hedgefund acquired more than 25% and threatened yesterday to block the deal
– under German law, 75% is the threshold to establish a profit & Loss transfer agreement which gives full control to the acquirer as well as tax benefits
As a result, the share price of Celesio dipped slightly below 23 EUR after hitting 23.70 EUR earlier.
The offer
McKesson has actually created a dedicated website for the offers with all documents, some videos etc here including the detailed offer document.
The acceptance period runs until early January with a potential extension period until end of January. Similar to Vodafone/Kabel Deutschland, talks about the take over become public already several weeks before the official offer. I think this is clearly part of the game from the seller in order to get a good price.
Nevertheless I found it surprising that since the first announcements of the deal, McKesson’s share price surged and dropped when Elliott said that they want more. Elliott is even using this as their main argument according to this article:
The surge in McKesson’s value by $7.7 billion since early October, when reports on a takeover offer appeared, was a clear sign the Celesio acquisition offers high synergies for the U.S. group and is a bad deal for minority shareholders, Elliott said.
Celesio looks clearly expensive at 23 EUR. However even without operational synergies there is a lot of potential for improvement. Celesio pays ~150 mn interest on 2bn loans, a 7.5% interest charge. McKesson is able to refinance below 2%, this alone is more than 100 mn p.a. savings.
Elliott Management
Elliott Management is a well known US hedgefund ran by Paul Singer. They are most famous for their over a decade long fight with the Argentinian Government, where some months ago, the even went so far to seize the sailing ship of the Argentinian Naval forces.
In Germany, they were already active in two similar Deals, Demag Cranes and Kabel Deutschland. At Demag Cranes, they already cashed out with a nice profit (~+30%), after blocking the threshold at 90% which allows a complete squeeze out. At Kabel Deutschland, the hold 11%, again blocking the squeeze out which works only if the acquirer has more than 90%.
With Celesio they seem to slightly change the tactic by acquiring 25% and actually threatening to block the entire bid. However, one aspect remains the same: They involve themselves only when Anglo-Saxon bidders are in the game. I guess they don’t want to involve themselves with potential unpredictable players in “Local feuds” like in the Rhoen case.
Anyway, one thing is clear: Elliott is clearly not a player which gets pushed around easily. On the other hand, they are in to make money. This is the main difference to the Rhoen case, where some of the players (B. Braun) wanted to block the deal at any cost.
Simple “Valuation exercise”:
I would assume that the “undisturbed” Celesio share price in the months before the offer was around 17 EUR. So if the deal falls through, at the current price one would experience a loss of -25%.
If we assume that there will be no “top up”, than we can easily calculate the implied current probability that the deal will not happen based on a simple “binary” model:
x = (current price-offer price) / (undisturbed price – current price) = (22.80-23)/(17-22.80) ~ 3.4%
Now if we want to speculate on a top up, we have to make two assumptions: How likely is a top up and how large will it be ? In order to keep it simple, I would assume a 50/50 chance for a top up and as I like “round” numbers, I assume 5 EUR per share or a final offer at 28.
This leads us to the following expected value under those assumptions:
Exp. value Celsio share = (3.4% x 17) + (48.3% *23) + (48.3%*28)= 24.25 EUR or around 10.6% higher than the current share price.
Not a monster undervaluation but still a very attractive “bet” as the time horizon is rather short until the end of January.
A Twist: The Convertibles
Up until recently, Celesio had to struggle to refinance their debts. So they had to offer two convertibles in the past, each with an amount of 350 mn EUR which convert each into 17 mn extra shares (current total shares out: 170 mn).
The 2014 convertible will mature in 2014 nd is not a big issue with regard to the take over. However, the 2018 convertible is in my opinion much more interesting. First of all, the official strike price of 22.49 EUR will be adjusted down in case of a take over to compensate bondholders for the conversion premium paid at issuance.
Unfortunateley, I could not locate the full prospectus, only the 4 page summary from Celesio’s homepage. One 100 k EUR bond allows the holder to convert into 4.448 Celesio shares at the initial conversion price of 22.49 EUR per share.
But now it gets interesting: In the case of a “change of control” event, the conversion price is adjusted downwards based on the following formula:
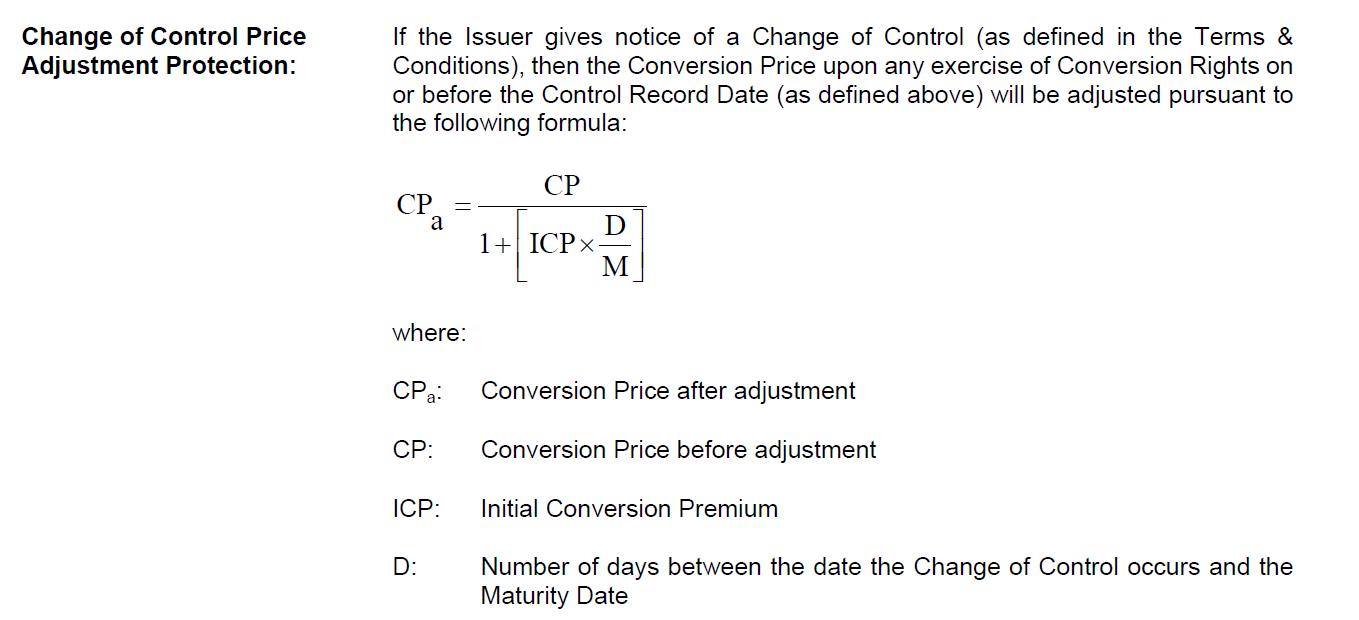
This means that holders of the bonds now get more shares than before.
The “new” conversion price now would be now approx. 18.99 EUR, and the amount of shares accordingly 5.266 per 100k nominal. This in turn, multiplied with a share price of 23 EUR would mean a fiar value of the convertible of 121k or 121%, pretty much exactly where it is trading now.
In total, the 2018 convertible will be exchangeable into 19 mn shares, more than 10% of total outstanding shares at any time after the take over happens. However, this could turn out to be a big problem for McK. Any company doing such a takeover wants to get rid of minorities as quickly as possible and is therefore trying hard to squeeze out shareholders and delist the company.
With the 2018 convertible, this could be very difficult. Even if McK owns more than 95% of the shares, convertible holders could suddenly convert bonds into shares and then make a squeeze out impossible. The 2018 convertible therefore has a quite high “annoyance factor” for McK. In general, when a company has a more complicated capital structure, an “annoying” security can be a very good security to own.
In the case of the convertible, the only possibility for MCK to get rid of the convertible early, is the so-called “soft call feature”. This enables the issuer to call the bond, if the stock price is at or above 130% of the initial conversion price of 22.48. This would mean a stock price of around 29,20 EUR or an implict bond price of 154%.
EDIT: The soft call in the complete prospectus refers to the “applicable” conversion price. So in our case, after a change of control, it would be ~19 EUR and the call level would be around 24.70 EUR. This reduces the upside potential of the convertible, but it might increase the chances of a better offer overall.
That those thoughts are not totally without merit could be indicated via the disclosure int he offer documents that they seem to be already buying busily convertibles with the focus on the 2018 bond:
McKesson International Holdings IV S.à r.l., eine mit der Bieterin gemeinsam handelnde Person, hält 105 Anleihen 2014, welche zum regulären Wandlungspreis Wandlungsrechte in 233.437 Celesio Aktien gewähren, was 0,137% der derzeit ausgegebenen Celesio Aktien entspricht, und zum angepassten Wandlungspreis infolge eines angenommenen Kontrollwechsels am 17. Januar 2014 Wandlungsrechte in 242.494 Celesio Aktien gewähren,
was 0,143% der derzeit ausgegebenen Celesio Aktien entspricht, sowie 139 Anleihen 2018, welche zum regulären Wandlungspreis Wandlungsrechte in 618.327 Celesio Aktien gewähren, was 0,364% der derzeit ausgegebenen Celesio Aktien entspricht, und zum angepassten Wandlungspreis infolge eines angenommenen Kontrollwechsels am 17. Januar 2014 Wandlungsrechte in 730.042 Celesio Aktien gewähren, was 0,429% der derzeit ausgegebenen
Celesio Aktien entspricht.
Swimming with the Sharks
Why did I call this “Swimming with the sharks” in the headline ? Well, this is clearly not a small unknown company. We have Goldman Sachs (advisor McK) and Elliott in the game, both very very clever financial market players which i would consider as “sharks”.
The true “decision” tree ogf the players involved clearly includes a lot more branches with some of them resulting in negative payouts for “innocent bystanders”. So there is always the possibility that one ends up as “prey” in such situations, so be careful and don’t bet the house on any outcome.
So to summarize this quickly:
1. The Celesio share looks like “good value” if one believes in a certain upside due to the Elliott involvement and no dirty deals on the side
2. The 2018 convertible looks like the even more interesting part. In order to get rid of this bond, MCK will have to offer ~30% more than the current price which I think is very likely even if the Elliott trade doesn’t work out
In order to play both “games”, I will allocate 1.25% each for the portfolio, the stock and the 2018 convertible at current prices (22.80 EUR, 121%).
Sometime it is scary how fast time flows. 3 years have passed since the first post appeared on this blog.
According to the statistic tool of WordPress, in 2010, the blog had 310 “hits” which translates to around 20 per day. In 2013 this number has increased by the factor of 50.
This might be the right place to say a big “THANK YOU” to all readers and an even bigger “THANK YOU VERY MUCH” to everyone who has contributed either via comments and or EMails.
Top 10 posts this year
1. How to correctly calculate Enterprise Value
2. My 22 investments for 2013
3. Operating Cash Flow and interest expenses – (ThyssenKrupp vs. Kabel Deutschland, IFRS vs. US GAAP)
4. Risk free” rates and discount rates for DCF models
5. Kurzanalyse Prokon Genußrechte
6. TGS Nopec ( ISIN NO0003078800) – an “Outsider” Company Buffet would buy if he could ?
7. P/E, EV/EBITDA, EV/EBIT, P/FCF – When to use what ?
8. Berkshire Hathaway 2012 listed stocks performance
9. Piquadro SpA – Competitors, market analysis and strategies
10. Spin off watch: Osram Licht AG
Interestingly, the “general interest” posts generate a lot of traffic. My guess is that many business administration students are using Google instead of reading their books……
Why I (still) blog
For me, this form of writing is the single best way to focus and structure my investment ideas. As I can spend only a limited time per day on this and my “physical” record keeping abilities are quite limited, the blog enables me to effectively organise my research and quickly revisit each thought.
The second most important issue of blogging is feedback. I am a big believer in getting “challenging” feedback. Yes, there are also forums etc. but via the blog it is much easier for me to keep track of discussions. I am also very proud that the comments I get are on average of much much higher quality than the discussions in many investment forums.
How I do it
Sometimes I get asked how I have so much time for blogging. To me this is surprising, as I spend “only” around 1-1.5 hours (week ends included) per day on my private investments in total. For me, researching stocks and writing a blog post has become an almost seemless process. I mostly read electronic documents. For instance, when I was researching the Metso/Valmet Spin off, I make notes already into the blog. It then takes maybe 10-15 minutes to structure the notes into a blog post. So overall, the effort of writing the blog itself is not so big and only around 10-20% of my “private investment time”. However, I have to admit that I spend the rest of the day with somehow related finance topics 😉
Interestingly, the “structuring” part is also the part where I sometimes have to change my initial opinion. I guess this is some kind of “second level” thinking. Several times, I had a pretty solid opinion early on when looking into the stock, which then changes before actually releasing the post.
On going “professional”
Sometimes I get also asked, why I am not ging into “professional” investing. One of the big issues in my opinion is the institutional set up of many investment organisations. In many cases, time horizons of such institutions are rather short and analysts are forced to specialize within categories and sectors. This leads to the strange situation that even passionate investors often don’t really enjoy working in such environments, because more often than not Asset Managers are run by “business persons” which want to increase AuM before anything else.
I sometimes dream of setting up my own fund, however so far I did not have the courage to actually do so. I guess it is not easy to find enough investors for the kind of “go anywhere, invest in potentially everything” style I prefer without a “formal” track record.
Lessons learned (hopefully)
I am not sure of my investment approach has “evolved” but it has clearly changed since I started the blog. A few subjective observations:
– I trade a less than before. I am down from around 30-40 changes in portfolio constituents per year to 10-20. That doesn’t sound much but is effectively a doubling of the average holding period
– 4-5 years ago my portfolio would have been 97% German, now it is around 25%
– I used to focus mainly on price/tangible book value, today this is a rather secondary criteria
– looking at business models has become a much more important part of my analysis. I still don’t like to pay for growth but it prevented me from investing in some potential value traps
– “special situation” investing has become a bigger part of my portfolio
Personal highlights
Finally a few personal highlights from the last year:
1. The real high light was clearly my trip to Omaha to see Charlie and Warren live.
2. The biggest learning experience was clearly the IVG case. Although I lost money with that I think I gained a lot of insight for potential future distressed situations. Especially when to stay away….
3. My goal to establish and further develop my qualitative investment checklist has worked out very well. Having such a tool really adds a lot to the investment process.
4. Finally, Dart Group, my first “triple” while writing the blog was great fun and a great success for my “boring company” philosophy.
So before it is getting too boring, once again a big THANK YOU for reading and commenting and I am looking forward to the next 3 years.
Edit: I often get mails or comments lie “I think share xyz is undervalued, can you write a post about it”. I am very sorry, but usually I will not and cannot contribute a lot of meaningful answers. Unless it is a stock which I have analysed in the past, usually my own “pipeline” is so big that I do not have the time to look at each and every stock in a meaningful way. So unless it is connected in some way to my existing portfolio or there is a special “twist” or something, don’t expect much of an answer. I am not Jim Cramer or some simlar guy who has an opinion of each and every stock in the market.
Very interesting research from Credit Suisse about mean reversion
Funny collection of investment fads over the years by the Reformed Broker
Nate from Oddball looks back at 250 posts
Why you should ignore economic forecasting
Wexboy is “going Buffet” (or kind of)
Metso is a Finish Industrial machinery maker which serves mainly the Mining and Construction, Automation and Pulp, Paper and Power Industries.
![]()
I had mentioned ThyssenKrupp already several times in the blog, last time when “patriarch” Berthold Beitz died in August as a potential special situation if they would do a big rights issue.
In the meantime, a lot of stuff happened, among them:
Read more
Performance review November:
In November, the portfolio gained +0.5% vs. +2.3% for the Benchmark (50% Eurostoxx, 30% DAX, 20% MDAX), an underperformance of -1.8% for the month. YTD, the portfolio is still ahead with +31.2% vs 27.3%.
If your have time for only one item this week, then read the latest memo from Howard Marks
Joel Greenblatt on value investing and patience
Very good interview with Marc Adreessen, one of the “pioneers” of the WWW
Good review about a new book called “”The Frackers: The Outrageous Inside Story of America’s New Billionaire Wildcatters””
Discovered by chance: Walter Schloss video on value investing (first 3 minutes).
Interesting article in the Ecominst on the Bitcoin Mining Industry
One more: Frenzel & Herzing with a new Vetropack analysis
Disclaimer: This is not an investment advice. The author will most likely own the stock already and sell it without telling anyone as well….

As the post is rather long, a short Elevator pitch:
– TGS Nopec is a potential “outsider” style oil services company with a distinctive and capital efficient business model
– currently cheap because of cyclical issues, negative sentiment for the oil and natural resources and top line decline yoy
– underlying business much less sensitive to oils price than the market believes and yoy top line decline is due to “outsider” behaviour
