Monthly Archives: June 2013

Kabel Deutschland & Vodafone reloaded

One of my two remaining short position gets “smoked” today. Kabel Deutschland is up ~7% to a new ATH:

The reason is once again the (now somehow confirmed) rumour that Vodafone wants again to take over KAbel Deutschland:

It started (again with the “rumour” as last time:

(Reuters) – Vodafone Group Plc has made an informal takeover bid within the past week for Germany’s biggest cable company, Kabel Deutschland Holding AG, Bloomberg reported, citing people with knowledge of the matter.

In the meantime, to my surprise, Vodafone confirmed the talks:

LONDON—Vodafone Group PLC said it has approached Germany’s biggest cable operator Kabel Deutschland Holding AG about a possible takeover, a move that would mark the U.K. mobile-phone company’s largest acquisition in Europe in more than a decade and add more customers to its triple-play offering of TV, mobile and broadband.

“There is no certainty that any offer will ultimately be made, nor as to the terms on which any such offer might be made,” Vodafone said in a brief statement Wednesday.

Kabel Deutschland confirmed it has received a preliminary approach from Vodafone, but also said there is no certainty an offer will be made.

So this is clearly against my expectations when I made the short. I have to admit that I don’t understand Vodafone. Why would they start such talks again with the danger of a leak again when the exact same thing happened a few months ago.

My only explanation is that they are either extremely desperate or extremely stupid. Or both.

Vodafone shareholders didn’t seem to be too enthusiastic either. So lets wait and see what happens. One first lesson is clear: Never underestimate the stupidity of others. Vodafone has done already one horrible overpriced German acquisition (Mannesmann) in the past. However, most likely most of those people who did this back then were already fired and now they make the same mistake again.

Clearly I also made a mistake here. It is definitely much more risky to short stocks with no majority shareholder in an industry which is famous for overpaying for M&A transactions.

EDIT: Real time comment for a quite “famous” Vodafone investor:

Vittorio Colao the urbane but seemingly incompetent CEO of Vodafone is the new Sir Fred Goodwin.

Update Greek GDP Linker (ISIN GRR000000010) – research mistake or by-product of value investing principles ?

Last year I had a couple of posts about the (in)famous Greek GDP linker (introduction, valuation approach) a result of the “restructuring” of Greek debt last year.

I concluded that the security is fundamentally worthless and criticised in August 2012 a post by FT’s John Dizzard recommending the linker at 33 cents. In the last few weeks and months, I recognized increasing clicks on my old articles and I even got an Email from a UK based hedge fund manager asking for the prospectus.

So its time to look at the score between me and the FT since I wrote that post:

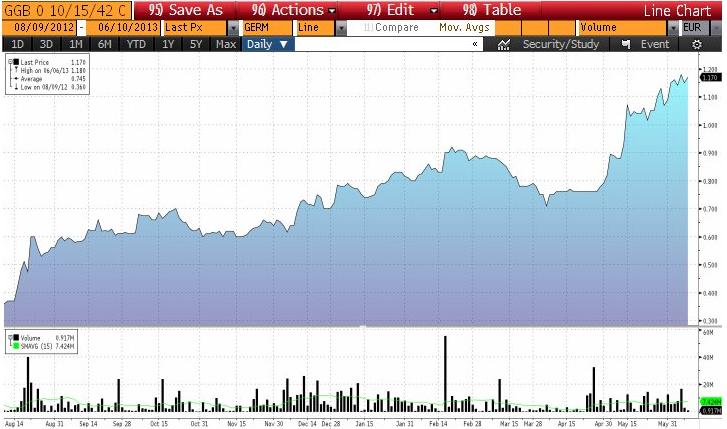
Holy cow !!! The price of this security tripled since I made fun of the FT. guy, so I would say 3 for the FT, nil for me.

First lesson learned: I was clearly wrong on that one for the time being. If you followed the FTs advise, you made big bucks in only a year. if you have followed my advice you made nothing.

So whenever I see one of my analysis going wrong so horrible, I keep asking myself: Was I wrong or ist the market (price) wrong ?

Let’s go back to the fundamental analysis and see if something has changed to the better in the meantime ?

Well, the Greek stock exchange doubled, but as we know for the analysis, for the GDP linker the only two things that count are: Nominal value of GDP and GDP growth rates. Let’s look at the hardest hurdle which in my opinion is nominal GDP.

Those are the levels of nominal GDP required to get a single cent out of this security:

year nominal GDP yoy
2014 210.1  
2015 217.9 3.71%
2016 226.4 3.90%
2017 235.7 4.11%
2018 245.5 4.16%
2019 255.9 4.24%
2020 266.47 4.13%
therafter 266.47 0.00%

So again, let’s go to the original Greek statistics website and do a quick update on Greek GDP including 2012:

Year GDP
2000 136,281
2001 146,428
2002 156,615
2003 172,431
2004 185,266
2005 193,050
2006 208,622
2007 223,160
2008* 233,198
2009* 231,081
2010* 222,151
2011* 208,532
2012* 193,749

So we can clearly see that nominal GDP decreased quite dramatically. For 2013 it doesn’t seem to get much better. If we look at the last quarter, we can see that in Q1, Greek GDP decreased ~ 7% on market prices basis.

So lets just assume that things pick up in the rest of the year and the Greek GDP shrinks only by -5%. That would leave us with a GDP of around 184 bn. Now we can easily calculate what kind of compound annual growth rates (CAGR) Greece needs in order for the GDP linker to “jump” the nominal GDP hurdle:

Hurdle Actual CAGR required
2013   184  
2014 210.1   14.2%
2015 217.9   8.82%
2016 226.4   7.16%
2017 235.7   6.39%
2018 245.5   5.94%
2019 255.9   5.65%
2020 266.47   5.43%

This table can be read as follows: In order to hit the GDP hurdle in 2014 (and receive money in 2015), Greek GDP has to rise 14% in 2014. Or: in order to hit the hurdle in 2015 (and get paid in 2016), the Greek GDP has to have a compound growth rate of 8.8% in 2014 and 2015.

Now it is clearly open to discussion how likely that is. I would however argue fundamentally this is more or less impossible because Greek is under a lot of deflationary pressure.

So the fundamental outlook didn’t really improve from last year, but why the hell did the linker trade up so much ?

I have a few explanations:

a) The linker looks optically cheap. It “officially” trades at 1.1% of nominal value, so for many investors that means it trades “for almost nothing”. In the post last year I mentioned, that the quotation is highly misleading. As the maximum cash (undiscounted) you get is around 18% of the stated “nominal”, the linker is in fact trading rather at 1.2/18= 6.7% of nominal, not adjusting for coupons. So still “cheap” but not so cheap as some investors think.

b) Argentinian experience: Argentinian GDP linker have been a very good investment. However part of that was that Argentina could inflate its economy because they have their own currency. Greece can not inflate in EUR, instead they have to deflate salaries, costs etc. This is fundamentally different to Argentina.

c) People are betting on some kind of Greek recovery and use the GDP linker as a levered proxy for a Greek recovery without really understanding it.

Of course, my fundamental analysis could be all wrong and I missed something. However I woudl need to read something fundamentally justified to accept this. If someone knows something about such a piece of research, please let me know !!!

Summary (and implications for value investing):

I was clearly wrong about the future price of the GDP linker last year. However I am still convinced that I am right on the ultimate “value” of this GDP linker which is close to zero. So one could see this as a weakness of the “value investing” approach because I never consider that someone might pay a higher price despite the value of this security being close to zero.

And clearly, as a value investor you rarely share in “speculative gains” but on the other hand, you also avoid many speculative losses if you really stick to your strategy.

This is also one of the biggest mistakes (and one of the hardest parts of the startegy) I see with some value investors: It is really hard to resist the urge to “speculate” at some point in time. Our mind often plays tricks on us that we can recall great trades much easier than bad trades. But i think that mixing in speculations (investments not based on intrinsic value but based on the hope that someone buys it even more expensive) into a value investing strategy might be the biggest “detractor” for a superior long term performance.

For every GDP linker you miss out as a value investor, you also miss out a couple of “bad trades” and in my experience the balance of those missed out trades is negative (or positive for your performance) over the cycle.

There are clearly people who are great “speculators” and got rich with that (Soros & Co), but for every successful speculator, there is a large graveyard of bankrupt losers. Whereas I don’t know that many bankrupt value investors…..

Book review: Poor Charlie’s Almanach – Peter D. Kaufmann

This was one of my few “souvenirs” from my pilgrimage to Omaha some weeks ago.

The book can be basically divided in 2 parts:

1) The first 150 pages or so is some “Almanach style” collection of quotes, interviews, observation and general concepts of the “Munger style”
2) The remaining part then are transcripts/manuscripts of talks, Charlie Munger had given over the years

The speeches themselves are of course most interesting, as this is Charlie’s original work.

Those are the 11 talks / speeches

1) Harvard school Commencement Speech (1986)
Major concepts: Reliability, inverting problems

2) Talk at USC (1994)
“Worldly wisdom”, combining knowledge from many different areas, multiple mental models
Economics of scale / dumb bureaucracy, specialisation
Airlines vs. cereals, when does technology help or kill a business ?
Incentives

3) Stanford Law School 1996
make systems cheating proof, large companies shouldn’t produce football helmets

4) Practical Thought about Practical Thought (1996)
Mental model, Coca Cola case,

5) Harvard Law School reunion (1998)
Academic multidisciplinary

6) Investment Practices of Leading Charitable Foundations (1998)
Bernie Cornfeld, deficiencies of professional money management

7) Breakfast meeting of the Philanthrophic Roundtable (2000)
“febezzlemant”

8) The great Financial Scandal of 2003 (2000)
Option accounting at Tech companies

9) Academic Economics, USC (2003)
Raising prices often raises sales opposite to classical economic theory

10) USC Law School Commencement address (2007)
constant learning, acquisition of wisdom.LEarning machine”

11) The Psychology of Human Misjudgement
25 psychological “mental models”

At the end of the book, there is also a recommended reading list. The one from Charlie Munger himself can be found for instance here.

Summary:

I think it is a “MUST READ” for any serious disciple of the “Value Investing” School. It is basically the only book where you can find a lot of knowledge about the “number 2” guy at Berkshire Hathaway. For many people, the success of Berkshire is the success of Buffet. I am pretty sure, Buffet would have done well without Charlie, but I would not underestimate the contribution of Munger to the “Later stage” success of Berkshire.

The book is not an easy read and I will have to read it again. Although the author tried to compile it in a coherent way it is clearly not a “Bruce Greenwald” style step-by-step book or a “how to get rich quickly” publication.

One warning: It is a real heavy (1 kilo) big book. I “schlepped” this one back from Omaha and no, I will not take orders if I go to Omaha again next year.

Performance review May 2013 – Comment “Position sizing”

Performance:

May has been s surprisingly good month for the portfolio. Despite ~15-20% cash, the portfolio gained +4.9% against +4.5% for the benchmark (50% Eurostoxx, 30% Dax, 20% MDax). YTD this results in +19.6% against +12.0% for the Benchmark. Since inception (Jan 1st 2011), the score is now +57.7% against 22.1%. As I have said many times, this is still highly unusual if the portfolio outperforms in such a strong month, especially now with the high cash percentage.

Main drivers were: EMAK (+27%), Dart Group (+22%), April (+16%) and Tonnellerie (+13%)

Portfolio activity

May has been an unusual active month. As discussed, the following transactions took place:

– sale of IVG convertible with a total loss of -16,3%
– sale of Buzzi with a total gain of +34% (incl. dividends)
– Sale of KPN shares & rights with a gain of 11.1%
– Purchase of IGE & XAO
– Purchase of EGIS
Edit: – Short Position Focus Media has actually been bough, exit with a loss -11.9%

Portfolio as of May 31st 2013:

EDIT: Buy out of Focus Media updated

Name Weight Perf. Incl. Div
Hornbach Baumarkt 3.7% 3.4%
AS Creation Tapeten 4.3% 49.3%
Tonnellerie Frere Paris 5.7% 83.3%
Vetropack 4.1% 9.7%
Installux 2.7% 10.1%
Poujoulat 0.8% 6.4%
Dart Group 4.7% 171.2%
Cranswick 5.4% 33.8%
April SA 3.6% 19.4%
SOL Spa 2.7% 35.8%
Gronlandsbanken 2.1% 23.2%
G. Perrier 3.0% 11.3%
IGE & XAO 2.0% 4.1%
EGIS 2.5% 0.4%
     
KAS Bank NV 4.6% 27.6%
SIAS 5.5% 59.5%
Bouygues 2.4% 7.0%
Drägerwerk Genüsse D 9.2% 186.2%
DEPFA LT2 2015 2.7% 64.1%
HT1 Funding 4.6% 58.2%
EMAK SPA 5.2% 64.9%
Rhoen Klinikum 2.2% 10.8%


Short: Prada -1.0% -20.4%
Short Kabel Deutschland -1.0% -5.7%
Short Lyxor Cac40 -1.2% -15.5%
Short Ishares FTSE MIB -2.0% -14.0%
     
Terminverkauf CHF EUR 0.2% 7.9%
     
Cash 21.0%  


Value 47.5%  
Opportunity 36.4%  
Short+ Hedges -4.9%  
Cash 21.0%  
  100.0%

Comment “Position sizing”

One topic which constantly bugs me is how to size positions.

There are two extremes:

On the one side, Modern Portfolio Theory (MPT) says that the only kind of “free lunch” available is diversification. Adding additional positions means more or less the same returns but with lower risk.

On the other side are very succesful investors, including of course our heroes, Warren and Charlie, argue that one should concentrate on the big ideas only as those are the ones which drive the returns. Similar results come out of the “Kelly criterion” which says that you should bet overp proportionally more if the odds ar in your favour.

Personally, as a “part time” investor, I have the following problems:

1) I can oversee only a limited amount of companies&investments, my max is around 25-30 based on experience. So further diversification on a single investment level does not make sense

2) As I am in general very sceptical and commit only a limited time per day on research, I never really came to a stage where I was 100% sure about any investment. Even if I am 95% sure I have the nagging feeling that I missed something

3) I usually find my “edges” only in small cap stocks or smaller special situations. Small companies have much more unique risk factors than large caps. It is a real difference in risk if you invest lets say 40% into a small French software company than investing 40% of your portfolio into an international company like American Express

Point 2) is really the major issue why I hesitate to commit more than 10% of my portfolio into a single stock. I am just not confident enough in any company or investment to do so.

Looking back, my historical best investments, like for instance German bank hybrid in 2009 was made under a lot of uncertainty and I didn’t really know for sure if it plays out the way it did. The same goes for Draeger. Yes it was a multi bagger, but at least for me I was never really sure about it.

On the other hand, some small ideas where I didn’t really have a lot of conviction, performed outstanding, like Dart Group which was rather a kind of “mechanical” buy. Also sometimes a basket approach to risky or very illiquid small caps (France) makes sense.

In general, I think that there is no single optimal strategy for postion sizes. As every part of the investment process, this has to fit with the overall character of the investor, including risk tolerance, investment style and time available. With regard to the “kelly formula”, I have the fundamental problem that I neither determine the payouts nor the probabilities, so this is not a big help eithet.

For the time being, I do not have a better system for my personal situation than my current one which looks like this:

–> Full positions at 5% (increase via peformance until 10%)
–> half positions at 2.5% if I buy into a stock
–> plus a basket approach for my illiquid French small caps.
–> occasionally small position for “half baked” ideas
IMPORTANT: Weed out weak conviction positions if overall numbers of investments get close to 30 single stock investments (long & short, ex index hedges)

So far it has worked quite well, but there is always room for improvement.

Recent Entries »