Category Archives: Exotische Wertpapiere

Exotic securities: Gabriel Finance 2% 2016 Evonik Exchangeable (ISIN DE000A1HTR04)- Free options anyone ?

Background / Evonik

Evonik is a German specialty chemical company with a total market cap of ~12 bn EUR. The company went public in 2013, however the majority is still Government owned via RAG (“Ruhrkohle AG”), the German coal mining “run off” company.

Private Equity shop CVC bought a 25% stake in Evonik in 2008. At the end of 2013, CVC issued a 350 mn “exchangeable” bond which exchanges into EVONIK shares if certain thresholds are hit.

The “exchangeable”

Just for clarification: An “exchangeable” bond is a “convertible” bond which is NOT issued by the company of the underlying shares but by someone else. But let’s look at the bonds:

Volume: 350 mn EUR
Maturity: 26.11.2016
Coupon: 2% (semi-annual)
Denomination: 100 K EUR (so not for retail investors…)
Exchange ratio (Nominal/number of share): 2.821,8774 shares per 100 k
Strike price/break even: 35,437 EUR
Stock price “cap”: 130% (Gabriel can call the bond if the share price hits 130% of the exercise price)

So far the structure is fairly typical for a normal “convertible/exchangeable” bond:

– as long as the stock stays below the “strike” one will get back the nominal amount (plus coupons)
– if the stock rises above the strike, one can exchange the bond into the shares and realize the upside which equals a call option on Evonik
– however the upside is “capped” at around 130% of the strike which is similar to a “short call” option on top of the long call

Technically, the bond can now be evaluated by calculating the value of the long call option minus the value of the short call and add this to the “Pure” bond value, which is the nominal plus the coupons discounted back at the “risk adjusted” rate.

The NPV of the long option is around 2,6% of the bond nominal, the short call is worth around -0,5% under standard settings. So this would add almost 100 bps p.a. in option value to the bond. As the bond itself trades around 98%, together with the 2% coupon it looks like that the buyer gets a juicy 3% yield plus a free option on Evonik, so almost a “no brainer” trade in the current interest rate enironment (2 year swaps are at 0,25% p.a.).

The “exotic” feature: The “short put”

But not so fast. CVC has built in something which makes this bond “exotic”: The issuing entity, Gabriel Finance has no additional support from CVC. The issuing entity owns the shares and the shares are pledged to the bondholders, so far so good. But what happens if the stock of Evonik falls below the assumed exchange ratio ? For this case, they have allocated an additional amount of shares to the bond holders, in this case the same amount of shares as are actually the underlying of the bond.

However, even this additional amount of shares might be insufficient if the shares would fall further. We can easily calculate the share price at which the original shares and the additional shares are not sufficient anymore to cover the principal:

“break even” = 350 mn / (original shares + additional shares) = 17,70 EUR er Evonik share.

So what happens if the share price drops below 17,70 EUR ? Well, the bondholders will not get the principal back but whatever the pledged shares are worth at that point in time. (Remark: I did not find out is there is the risk of an insolvency procedure or not)

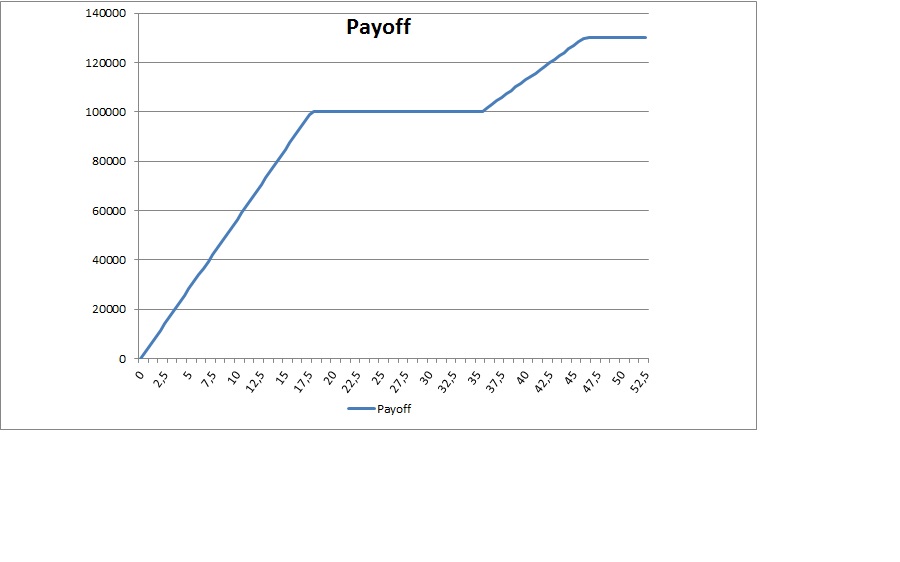
With a normal exchangeable, the issuing entity would have to make up the shortfall with any other asset they own but in this case, there is none. It is maybe easier to understand if we look at the final payout of the bond in relation to the then prevailing Evonik share price which I graphed using Excel:

gabriel payoff

In order to correctly value the whole “option package”, we will therefore need to

+ add the value of the long call
– subtract the value of the short call
– subtract the value of the put option.

Beware of the Skew

Valueing long dated stock options is a tricky thing. The major input clearly is the volatility of the underlying stock which has a major impact on the value of the option. The volatility to use depends on a couple of things, among others how far the option is out-of-the money.

In our case, the following effect is important: If you have both, a put and a call option for the same stock with the same “distance” to the current price, the put option is usually more expensive than a similar call which means you have to pay a higher volatility. Nobody knows really why this is so but it is a fact and is called the “Volatility skew”.

Finally, another “exotic feature” needs attention: The mechanics explained above mean, that in th positive case, you are long around 2821 shares per bond in th upside case. However, once you hit the downside trigger at 17,70, you are suddenly short 2×2821 shares.

So you need to buy twice as many puts at 17,70 EUR than you could sell calls on the upper end (that’s also the reason why in the Excel graph above, the slope in the downside case is much steeper than in the upside case).

Valueing the whole “package”

So in order to find out how attractive this bond is we need to calculate the “option adjusted” yield of the bond by adding/subtracting the option values to the purchase price and then calculate the yield with the 2% coupon (implied volatility for short call and short puts +6% vs. long call):

EUR In % of Nominal
Purchase price 98000,00 98,0%
minus long call -2624,35 -2,6%
Plus short call 1608,47 1,6%
Plus short put (2x) 5643,76 5,6%
“Option adjusted” Purchase price 102627,88 102,6%

Based on the adjusted purchase price of ~102,6%, this results in an annualized yield of ~0,78% p.a., which is ~0,5% above swap but hardly super attractive.

Summary:

Unfortunately, the Gabriel/Evonik exchangeable is not the nice 2% carry plus free option trade I was hoping for in the beginning. Depending on the assumptions with regard to volatility, the bond actually looks like fairly and efficiently priced. For a pure bond fund who can invest into the bond on a fully hedged basis, this still has some spread left, but if you want to achieve “stock like” returns, then the risk/return profile is not overly attractive.

Clearly my assumptions with regard to volatility are debatable and you could price the short options cheaper, but with options I prefer to make mistakes by being too conservative on the short side. On top of that, as I have mentioned a couple of times, I am not comfortable with German law for bonds and unfortunately this one is issued under German law which makes it relatively easy to change important features of the bond such as coupons and maturities.

Even if one is really bullish on Evonik, buying the underlying stock would be the better choice in my opinion, so for the time being the Gabriel/Evonik exchangeable is not interesting for me, especially as I don’t like the “Black Swan” exposure via the short put.

Depfa: No sale, LT2 and the “Kebab Zerobond” (ISIN XS0221762932)

Warning: The securities discussed are illiquid and/or risky and the author might have bought them already before publishing the posts. Please do your own research and if you decide to invest nevertheless, use apropriate limits !!!

Background:

For readers of my blog, Depfa is no stranger. I did buy a 2015 floating tier 2 subordinated bond in 2011 and this has been a very good investment so far.

To summarize the story of Depfa for “new” readers quickly: Depfa was initially a “full service” German mortgage bank which then split up into a German mortgage bank (Aareal) and an Ireland based “public funding” bank (Depfa Plc). Shortly before the Lehman crisis, Depfa got bought by another German mortage bank, HypoRealestate (itself a spin-off from Hypovereinbsank). The rest is history: Depfa/Hyporeal Estate was the first bank to go belly up and needed to be rescued by the German Government.

After beeing rescued, the startegy was to concentrate on German Mortgage banking and to sell the old Depfa part (which has been “cleansed” from PIIGS exposure via a bad bank). The sale process seemed to have been already quite far advanced, with Leucadia as favourite, before very surprisingly the German Government pulled the sale in the last minute before closing.

Germany has intervened to prevent bailed-out bank Depfa from falling into US hands just hours before a deal was about to be struck.

The government’s financial market stabilisation fund, known as Soffin, said on Tuesday evening that Depfa should be wound down by the German authorities rather than sold for what would have been €320m to US investor Leucadia, according to people familiar with the deal.

What does that mean for Depfa bonds in general ?

Tier 1 bonds of Depfa got hit quite hard, although one must say that they enjoyed a great run up until then as this chart shows:

The reason here is I think the expectation that the FMS, which will have the task to run down Depfa, will not do anything actively with the subordinated bonds, whereas any private buyer would have tried to get the subs out as soon as possible under par in order to realize value more quickly.

Although it is not clear, how Depfa will be passed over to FMS (most likely a sale at book in my opinion, in order to facility a Hypo Real Estate sale in 2015), I think it is fair to asume that sooner or later FMS will be the owner of all assets and liabilites.

FMS itself is a Government owned “bad bank”. As bad banks need constant refinancing, FMS issues new bonds on a regular basis like this one. FMS is owned by SOFFIN, the German “bank rescue” vehicle, which itself carries an explicit Government guarantee. A good description of the FMS can be found here (in German, page 108 ff).

So once, Depfa has been transferred to FMS, in principle the liabilites should be considered FMS liabilities which again carry a AAA rating and trade more or less at levels similar to KfW.

Impact on subordinated bonds

The bloomberg article above mentioned that Depfa subordinated investors were afraid of the following:

“The main risks facing creditors now are the risk of burden-sharing as well as an indefinite coupon ban,” the analysts wrote in a note to clients on May 14. “It’s difficult to see clear upside from current levels and further volatility is likely.”

I share the opinion that it is very unlikely that coupons on Tier 1 bonds will be paid in the near future, although, at some point in time FMS might want to buy out the Tier 1 investors as well. But at current levels (50% of nominal), this is not a very attractive speculation.

However for the Tier 2 bond I own, the transfer of Depfa to the FMS is actually good news. I cannot think of any realistic scenario which would lead to a loss for the Tier 2 until maturity in 2015. If they would like to screw those bond holders, I am pretty sure they will have issues refinancing and this is the last thing they want. The LT2 bond priced consequently barely moved as we can see in the Chart:

So far, the LT2 has been a very good investment. Around 30% annualised return with, in my opinion, very little risk. If one has cash to park, I think the bond is even now a very interesting investment. You get around 5% annualized return until maturity December 2015 which is effectively Governemnt guaranteed.

I will therefore increase the position from a “half position” to a full 5% as I have plenty of liquidity in the portfolio to park.

The Depfa 2020 TRY “Kebab Zerobond” (ISIN XS0221762932)

When I started to look at Emerging markets earlier this year, especially when I looked at Koc Holding, I was surpried that Depfa had Turish Lira bonds outstanding.

When you search in Bondboard.de for TRY bonds which are traded in Germany it is even interesting to see that the 2020 Depfa TRY Zero bond is the highest yielding TRY bond available.

At a current yield of ~13% p.a., the bond trades around 4% p.a. wider than a 2 year longer EIB Zero bond and around 3% wider than similar Turkish Government (coupon) bonds.

Why does the bond look cheap ?

1. First of all, I think the problem is that the “official” rating of Depfa is BBB. Many investors will simply compare the bond with other financial BBB issues and apply respective spreads. As many of the Italian and Spanish banks are BBB as well, BBB financial spreads are high.

2. The bond is relatively small (425 mn TRY) and illiquid as the 100 K TRY denomination will deter many smaller investors (at ~47%, you need to pay around minimum 17k EUR to buy one bond). I think also, many investors prefer coupon paying bonds to zero bonds, for most investors “zero” bonds are an exotic security

3. Finally, I think not many people did like the combination of the Depfa structural risk and the TRY currency risk. Either you like Emerging markets and TRY or you want to play the Depfa capital structure, but usually not both.

However for me, the bond is the ideal combination: I do like the Depfa risk as I think that any Senior Depfa bond will be a AAA equivalent bond after the transfer to the FMS. Additionally I do also like the TRY risk. Clearly, there is downside potential and he TRY/EUR is still volatile as the chart shows:

As an investor you can gain (or loose) money with this bond based on 3 risk faktors:

A) TRY/EUR exchange rate. Based on the current interest rate differential, the market assumes that the TRY will devalue vy ~8% p.a. against the EUR.Perosnally, I see a good chance that the devaluation could be less than that. Under many metrics (PPP, BigMac index etc.) the TRY is fundamentally cheap compared to EUR and USD although there is clearly political and econimical riskimplied. The currency factor is clearly no “free lunch”.

B) Turkish interest rates. As a zerobond, the bond has a duration of ~6,5 years, i.e. if interest rates go up or down 1% the bond price will move +/-6,5%. Currently the yield curve in Turkey is flat or even inverse, with the short end slightly higher. even if long term rates stay constantand only short terms go down, one can expect some “extra juice” from the potential roll down of the bond.

C) Depfa Spread. Compared to an EIB Bond, the implicit credit spread is around 3-4% p.a. although in my eyes the credit risk is similar to an IB or german Government bond. I think there is also a good chance that this could normalize over 2-3 years. If there is some rating action following the transfer, this could even happen quicker.

All in all, I find the TRY Depfa bond very attractive and will by a half position for the portfolio. As the risk is predominantly TRY, I will allocate it to the Emerging Markets bucket.

My expectation is that I can make ~50%-60% in local currency within 3 years, if the yield curve normalizes and the Depfa Spread tightens including the normal “carry” of 13%. If half of that shows up in EUR, I will be already very happy 😉

Hedge fund edition

For a smart (hedge) fund with good access to securities lending, a long (Depfa)-short (TRY EIB 0% 2022) trade could be interesting. Despite the slight duration mismatch, this could be an interesting way to speculate on the relative spread tightening between Depfa/FMS and the EIB bonds with an interesting implicit positive carry, although I am not sure how easy it is to borrow the EB bonds.

Summary:

In my opinion, the planned transfer of the old Depfa to the FMS is good news for LT2 and Senior bonds of Depfa, as the bonds become effectively German Government equivalent. I will therefore increase my existing lT2 position up to 5% and invest a half position (2,5%) into the Depfa 2020 TRY bond as Emerging Market investment.

P.S.:Why did I call this the “Depfa Kebab bond” ?

Doner Kebab is the most popular German fast food.

Based on Turkish ingredients, the current form (with salad etc.) is supposed to be a Turkish-German invention and in my opinion a good omen that a Turkish-German combination can be really delicious…..

Exotic Securities: Piraeus Bank Warrants (ISIN GRR000000044)

Background:

First of all a hat tip to Profitlich & Schmidtlin which had mentioned this idea in their first quarterly letter.

Piraeus Bank is one of the “survivors” of the Greek Banking sector. As with other Greek banks, the bank was “rescued” by the Government via a dilutive capital increase, with the Greek Government as a majority shareholder. Those private investor who participated in the capital increase got as a kind of “compensation” (and exit vehicle) some Warrants “for free” which allows them to buy back the shares until 2018 from the Greek Government. Those Warrant are traded quite actively on the Athens Stock Exchange.

Maybe in order to make it more fun, the Greek Government spiced up the Warrants with some extra features which are ( a kind of term sheet can be found here)

one Warrant gives the right to purchase 4,476 shares from the Hellenic Stability Fund (so its non dilutive”)
– the final maturity is 02.01.2018, however there seems to be a kind of “forced” exchange possibility on 02.07.2016
– the Warrants can be exercised every 6 months, so its technically a “Bermudan option”
– the strike price increases every 6 months after a predetermined formula

At a first glance, this “thing” seems to be really hard to value. Bloomberg for instance does not offer to value “Bermudan Equity options” in its standard option valuation tool (OVME).

Bermudan Option

Let’s take a step back and look at principal option types. The two classical types are:

European Option: This option can only be exercised at the final maturity date
American Option: This option can be exercised on every day during the term of the option

Nevertheless, there is normally very little difference in the value of an European option and American one if all other things are equal. The main reason for this is that in normal cases, the “time value” of an option is usually positive until the very last day. Exercising an American option early and “throwing away” the time value normally doesn’t make sense. For “normal” stock options, the only reason to exercise early would be a large dividend payment before maturity which will reduce the value of a (long Call) option, but in most cases one can ignore the valuation difference between an European and American option.

On the other hand, the increasing strike price of the Piraeus Warrant is economically equal to a dividend, so we cannot just ignore this feature and value it as a European Option.

This is the call schedule and the corresponding strike prices for the Warrant:

Call Date Strike Delta
02.01.2014 1,734  
02.07.2014 1,768 0,034
02.01.2015 1,811 0,043
02.07.2015 1,853 0,043
02.01.2016 1,904 0,051
02.07.2016 1,955 0,051
02.01.2017 2,015 0,059
02.07.2017 2,074 0,059
02.01.2018 2,142 0,068

From what I know, Piraeus Bank is not supposed to pay out any dividends in the foreseeable future. So in order to replicate the increasing strike, we could assume that the increasing strike is similar to a dividend assumption and we model this as an option with a strike of 1,734 EUR and dividends as shown in the column “Delta”.

Using the Bloomberg Option Valuation tool “OVME”, the same volatility and the assumption of a July 2016 maturity, the value difference between an European and American Option would be almost 20%, i.e. the American Option with the possibility to exercise at any day is 20% more valuable than the European one. This is due to the fact that I can basically wait until the last day before the synthetical dividend is paid an exercise then. So I don’t lose any time value and save myself the full dividend compared to an European exercise.

In our case however, I have to exercise 6 months earlier. With the OVME tool, I can for instance also calculate the value of an American vs. European Option for 6 months, “simulating” the time between for instance 03.07.2014 and 02.01.2015. For those 6 months, the valuation difference between an American and an European Option is only ~ 10%. Again, the “Bermudan” option is worth less than an American.

If I am actually in the last 6 months of the warrant maturity, the day after the last exercise possibility, the option will be exactly worth the value of a European Option. The day before it will be worth slightly less.

Anyway, as a very simple working assumption, I will assume that the “Bermudan” feature overall is worth 5% more than a European option.

Valuation of Piraeus Warrant

In order to value the Pireaus Warrant, we will have to make one further assumption: What is the final maturity ? If I understand correctly, the Greek Government has the possibility, to sell the shares after July 2016 without compensation to the Warrant holders if the Warrant holders do not convert. So as a realistic assumption one should use July 2016 as final maturity and not January 2018.

By the way, this “mechanic” of selling the shares without compnesation is a very strange featre for a Warrant.

In the following exercise I will use as the share price for Pireaus the level of 1.73 EUR, for the warrant 0.94 EUR (price at the time of writing)

As the first valuation steps, we can now do the following:

1) calculate the price of the warrant per share which equals the current traded warrant divided by 4,475. This would be 0.94/4,475= 0,21 EUR per share
2) “plug in” the price into the option calculator and solve for implied volatility (based on the current strike of 1.734 EUR and the “synthetic” dividends)

As a result we get an implied volatility of ~31.3% for the European Option, 26.2% for the American . This is rather at the low side for Piraeus. It is always a big question which volatilities to use, short-term (10 day) or longer term. Only 10 day historical volatility would justify such levels, trailing 305,50 and 100 day volatility is more in the 40-50% range.

We can now do a third step and

3) plug in for instance 45% as volatility and add 5% premium on the price of the European option to get to our value estimate. In this case this would result in a fair value of 0.33*1.05= 0.35 EUR per share or ~1.56 EUR for the Warrant. Compared to the 0,94 EUR per share, this would mean that the warrants trade at around 40% discount to their “fair value” which is quite significant.

So should one now run out and buy this undervalued security ? I would say: Not so fast, we need to consider at least one other factor

Potential shortening of maturity

The Greek Government as counterpart has quite a bad reputation for sticking to its terms. By googling a little bit, i found this quite revealing story from Reuters.

Two quotes here:

Some of Greece’s biggest banks and their advisors are starting to press the country’s banking rescue fund to look at ways to speed up their return to wider private ownership, banking sources say.

“They recognize that there are arguments to support the early retirement of the warrants,” he said, adding that the proposals would be favorable for the HFSF because it would no longer face a ‘cliff’ of all the warrants being exercised together.

However, any changes would have to be approved by the troika of European Commission, European Central Bank and IMF officials overseeing Greece’s bailout, who would be keen to make sure any changes did not disadvantage the HFSF or gift overly generous terms to the private investors.

In my opinion, this should make any holder of the Warrants really nervous. Currently, the Piraus Warrants do not have any intrinsic value, as the price of the share is below the strike. So all value is time value. With the option valuation tool we can play around a little bit with the maturity. Shortening the maturity (all other things equal) by 6 months for instance reduces the value of the Warrant by -10%, shortening it to July 2015 would reduce the value by more than -20%. The “break even” based on a 45% volatility would be some kind of “forced exercise” at the end of October 2014.

I do not know under which law the warrant has been issued, but if it’s under Greek law, then anything could be possible.

Valuation of Piraeus Bank

Finally a quick glance at the valuation of Piraeus Bank itself. Piraeus is currently valued at around 1,2 times book value. This is on a level with banks like Standard Chartered or Banco Santander, high quality diversified banks. However this is much higher than other domestic or regional players like for instance Unicredit (0.74) , Intesa (0,84), Credit Agricole (0,64) or even HSBC (1.05).

So without going into much detail, Piraeus bank looks rather expensive and a lot of recovery expectations seem to be priced in already.

Summary:

At a first glance and under some critical assumptions, the Piraeus Warrants do look undervalued by around 40% based on historical volatilities and the price of the Piraeus share. However there seems to be significant risks, that the terms of the Warrant could be subject to change with a negative impact on the warrant. ALso the valuation level of Piraeus bank itself looks rather optimistic.

I would not want to own the Warrants “outright”. For someone who is ale to short the shares, a delta hedged position could be interesting in order to “harvest” to low implied volatility, although there would still be the risk of the change in Warrant terms.

I haven’t looked at the other Greek banks where similar warrants have been issued.

Update Greek GDP Linker (ISIN GRR000000010) – research mistake or by-product of value investing principles ?

Last year I had a couple of posts about the (in)famous Greek GDP linker (introduction, valuation approach) a result of the “restructuring” of Greek debt last year.

I concluded that the security is fundamentally worthless and criticised in August 2012 a post by FT’s John Dizzard recommending the linker at 33 cents. In the last few weeks and months, I recognized increasing clicks on my old articles and I even got an Email from a UK based hedge fund manager asking for the prospectus.

So its time to look at the score between me and the FT since I wrote that post:

Holy cow !!! The price of this security tripled since I made fun of the FT. guy, so I would say 3 for the FT, nil for me.

First lesson learned: I was clearly wrong on that one for the time being. If you followed the FTs advise, you made big bucks in only a year. if you have followed my advice you made nothing.

So whenever I see one of my analysis going wrong so horrible, I keep asking myself: Was I wrong or ist the market (price) wrong ?

Let’s go back to the fundamental analysis and see if something has changed to the better in the meantime ?

Well, the Greek stock exchange doubled, but as we know for the analysis, for the GDP linker the only two things that count are: Nominal value of GDP and GDP growth rates. Let’s look at the hardest hurdle which in my opinion is nominal GDP.

Those are the levels of nominal GDP required to get a single cent out of this security:

year nominal GDP yoy
2014 210.1  
2015 217.9 3.71%
2016 226.4 3.90%
2017 235.7 4.11%
2018 245.5 4.16%
2019 255.9 4.24%
2020 266.47 4.13%
therafter 266.47 0.00%

So again, let’s go to the original Greek statistics website and do a quick update on Greek GDP including 2012:

Year GDP
2000 136,281
2001 146,428
2002 156,615
2003 172,431
2004 185,266
2005 193,050
2006 208,622
2007 223,160
2008* 233,198
2009* 231,081
2010* 222,151
2011* 208,532
2012* 193,749

So we can clearly see that nominal GDP decreased quite dramatically. For 2013 it doesn’t seem to get much better. If we look at the last quarter, we can see that in Q1, Greek GDP decreased ~ 7% on market prices basis.

So lets just assume that things pick up in the rest of the year and the Greek GDP shrinks only by -5%. That would leave us with a GDP of around 184 bn. Now we can easily calculate what kind of compound annual growth rates (CAGR) Greece needs in order for the GDP linker to “jump” the nominal GDP hurdle:

Hurdle Actual CAGR required
2013   184  
2014 210.1   14.2%
2015 217.9   8.82%
2016 226.4   7.16%
2017 235.7   6.39%
2018 245.5   5.94%
2019 255.9   5.65%
2020 266.47   5.43%

This table can be read as follows: In order to hit the GDP hurdle in 2014 (and receive money in 2015), Greek GDP has to rise 14% in 2014. Or: in order to hit the hurdle in 2015 (and get paid in 2016), the Greek GDP has to have a compound growth rate of 8.8% in 2014 and 2015.

Now it is clearly open to discussion how likely that is. I would however argue fundamentally this is more or less impossible because Greek is under a lot of deflationary pressure.

So the fundamental outlook didn’t really improve from last year, but why the hell did the linker trade up so much ?

I have a few explanations:

a) The linker looks optically cheap. It “officially” trades at 1.1% of nominal value, so for many investors that means it trades “for almost nothing”. In the post last year I mentioned, that the quotation is highly misleading. As the maximum cash (undiscounted) you get is around 18% of the stated “nominal”, the linker is in fact trading rather at 1.2/18= 6.7% of nominal, not adjusting for coupons. So still “cheap” but not so cheap as some investors think.

b) Argentinian experience: Argentinian GDP linker have been a very good investment. However part of that was that Argentina could inflate its economy because they have their own currency. Greece can not inflate in EUR, instead they have to deflate salaries, costs etc. This is fundamentally different to Argentina.

c) People are betting on some kind of Greek recovery and use the GDP linker as a levered proxy for a Greek recovery without really understanding it.

Of course, my fundamental analysis could be all wrong and I missed something. However I woudl need to read something fundamentally justified to accept this. If someone knows something about such a piece of research, please let me know !!!

Summary (and implications for value investing):

I was clearly wrong about the future price of the GDP linker last year. However I am still convinced that I am right on the ultimate “value” of this GDP linker which is close to zero. So one could see this as a weakness of the “value investing” approach because I never consider that someone might pay a higher price despite the value of this security being close to zero.

And clearly, as a value investor you rarely share in “speculative gains” but on the other hand, you also avoid many speculative losses if you really stick to your strategy.

This is also one of the biggest mistakes (and one of the hardest parts of the startegy) I see with some value investors: It is really hard to resist the urge to “speculate” at some point in time. Our mind often plays tricks on us that we can recall great trades much easier than bad trades. But i think that mixing in speculations (investments not based on intrinsic value but based on the hope that someone buys it even more expensive) into a value investing strategy might be the biggest “detractor” for a superior long term performance.

For every GDP linker you miss out as a value investor, you also miss out a couple of “bad trades” and in my experience the balance of those missed out trades is negative (or positive for your performance) over the cycle.

There are clearly people who are great “speculators” and got rich with that (Soros & Co), but for every successful speculator, there is a large graveyard of bankrupt losers. Whereas I don’t know that many bankrupt value investors…..

A bond camouflaged as stock: Societé D’Edition de Canal+ (ISIN FR0000125460) – Part 2

Following the first post about Societé D’Edition de Canal+ (“SECP”), let’s look how our “camouflaged” bond trades before we move to the valuation:

It is quite amazing to see this security trading so close to the CAC 40. For me it seems clear that not many are aware of the “special” characteristics of this security. Statistically, this translates “only” into a correlation of 0.48 and a beta of ~0.66 in this period but just from the graph one can see this is a very close relationship.

Compared to “parent” Vivendi, we can clearly see that SECP was the better investment:

Over the past 5 years, SECP and Vivendi moved closer together, but correlation is still much higher with the CAC40.

My valuation approach

So to summarize the results from the first post, for valuing the security, I will:

a) use only 90% of the guaranteed after tax result as coupon (plus the 2.5% growth rate)
b) expect so “sell out” at the end at NAV (incl. the 10% retained guaranteed profits)
c) will use discount rates as mentioned between 4.7% and 5.7% representing long duration hybrid high grade corporates
d) deduct a 0.25% from the discount rate for the “inflation protection”

Results:

Based on a current value of 4.525 EUR per share, my estimated cashflows represent an IRR of 8.2% p.a.

On a discounted basis, we get a fair value range of 6.87 EUR to 8.23 EUR per share, so quite a nice upside to the current share price but lower than the author determined in his analysis. The reason is simply the assumption of only using 90% payout ratio and not counting the cash upfront but the NAV “back ended” in year 2050.

Due to the long duration of the cashflows minor changes in those assumptions change the value significantly.

Opportunity / Special situation: Investor constraints

In principle, SECP would be a highly attractive high yielding long duration corporate investment for any pension fund or life insurance company. Due to the fact that this is officially a stock and it also behaves like a stock, many of those institutions will no be allowed to buy it as listed equity is a quite unpopular asset class these days.

On the other hand, for a typical equity investor, the stock is too boring, as a growth rate of 2.5% is not very sexy.

The characteristic of a long duration corporate exposure itself is relatively attractive as there is only very limited supply in the market. Most of the long dated (hybrid) stuff is financial which no one wants to buy these days. Long dated corporate exposure, especially to high quality corporate is very very scarce.

Catalyst

In the original research from the Value investor Club, the author says the following:

To review the corporate structure, C+ is 49.5% owned by C+ France, which is 80% owned by Vivendi and 20% owned by Lagardere. Lagardere has been trying to simplify its business and raise cash to repay debt over the past few years. It has been trying to sell its 20% interest in C+ France for a while, either as an IPO or to Vivendi, but has not been happy with the available prices. Lagardere has recently re-committed to sell its 20% interest one way or another in 2012. Vivendi has had an active policy of purchasing its French minority interests but has not yet agreed with Lagardere on price. Two weeks ago Bloomberg News reported that Vivendi will consider breaking itself up and will perhaps separate C+ Group from the rest of its businesses.

I am not sure how all this plays out, but I think that within 1-2 years C+’s parent company C+ France will be 100% owned by someone, and that there is a pretty good chance that party will want to acquire the 51.5% public float of C+’s shares. I believe that purchase will make economic sense at prices well above today’s €4.05 since at today’s price C+ is receiving a payment implying a 12.3% FCF yield. At €8/share the implied FCF yield is close to 5% and I think an acquirer would still want to purchase C+ at that level to avoid the cash payment, simplify ownership and eliminate any duplicated costs/public listing costs and tax inefficiencies. Vivendi can borrow short-term money at around 0.5% and long term below 5% so it has leeway to make a purchase at €8 that is EPS-enhancing.

I agree, that it is not totally unlikely that at one point in time Vivendi will repurchase the minorities. However one has to be careful not to overestimate the price they are paying. At the moment, the minority share costs them 6% dividend yield but has the advantage that it does not count as debt.

If Vivendi really would issue debt to repurchase minorities, their debt will increase, even if they could then consolidate the cash in SECP. At S&P, Vivendi has a BBB with negative outlook and more importantly a A-2 Short term rating with negative outlook. So even if its good for EPS, I think Vivendi does not have a lot of leeway to increase debt at the moment, especially if they would buy the Lagardere stake first.

Nevertheless, there is a relatively high probability that something might happen in the next 2-3 years.

How to tackle the stock volatility

So the problem is: SECP has a nice “special situation” angle, but for the time being it behaves like a CAC 40 index tracker without having a fundamental stock upside. It is a bond with an equity volatility. Normally I am rather looking for equity with bond volatility.

There are 2 potential ways to “mitigate” this:

1. Wait for the Stock to follow the CAC down in a correction and buy really really cheap.

2. Try to implement a long/short or hedge strategy in order to take out some volatility

The nice thing about SECP is that the dividend yield with 6% is higher than the CAC 40 yield with 4%, so we do have in principle a “positive carry” against the index (all other things equal).

In theory, one would implement a short position according to the beta of the stock to the CAC 40. Adjusted Beta has been quite stable to the CAC with 0.67, Raw Beta is at around 0.48.

I have run a quick simulation (30.07.2010-31.08.2012, daily basis) with some interesting results:

Standalone, the CAC 40 returned -6.3% against -5.2% for SECP for this period. Volatility was 10.2% for the CAC and 9.7% for SECP.

A static long / short (funding through the effective sale short position as an ETF) with a 0.67 short CAC position returned -2% ROI with a Vol of 10.9%, however a 0.5 CAC 40 short position returned -4% with a Vol of 8%.

A Long stock / short future (Ratio 0.5:1) strategy, despite requiring a higher capital investment shows almost “bond like” characteristics with a vol of 3.6% and a performance (before forward discount) of -1%.

Graphically we can clearly see that the index hedge (purple) creates a much less volatile pattern than the stock alone (green) and the long/short strategy (blue):

So this strategy could basically achieve the following:

– lower volatility to a “bond like” profile
– generating a small positive carry
– “extract” the special situation aspect

The result would be an “ok yielding” position with some small remaining market exposure and the “special situation” upside option.

Summary:

I was rarely so unsure about an investment as in this case.

On the one hand, it is clearly a misunderstood security with a potential catalyst trading at a quite attractive discount. So in the beginning I thought this really will be the next special situation investment.

On the other hand, I am usually looking for stocks which trade like bonds not vice versa. Also for a bond alone, the 8.33% IRR is OK but not spectacular. And for a bond you normally have a “hard” catalyst in form of a maturity or call date.

Also I don’t think we see a “gradual” revaluation, as there are just no natural buyers for this security. Maybe “yield hogs” will warm up to that at some point in time but I am not sure. They will rather buy crappy high yield bonds because this is the “right” asset class.

Combined with a CAC 40 hedge, Canal+ might be an interesting “special situation”. Although I am also not totally convinced that we see a short term buyout offer from Vivendi yet, so for the time being “no action”.

I would go long the security if prices come back to like 4 EUR or we see some action on the Vivendi buyout front.

Edit & lessons learned

This was again a good learning experience. If you invest a lot of time into analysing such a security, one is sometimes tempted to “make it look good” in order to justify the effort. I really felt this effect myself a couple of times. I think this is one of the typical mistakes made by many fundamental investors and something one has to monitor closely.

Efficient markets – WestLB Genußschein edition

As a quick follow up to the previous post, a quick reminder how innefficient the markets in those securities can be:

WestLB came out with their press release at 11 am CET yesterday. As discussed in the last post, the release started with a very small loss on a consolidated level. If the consolidated loss would have been mirrored in the local GAAP accounts, this would have meant a payout for the Genußscheine of around 95%.

However further down in the release they mentioned “casually” that the nominal repayment will only be 85.1% due to a higher local GAAP loss.

Interstingly, between 11:02 and 11:11 yesterday, aroudn 380 k of the Genußscheine were traded at 91%, which was clearly an inefficient price if one would have read the whole press release.

Unfortunately, I did not have the time to react on this, but some lucky guy found some lazy guy who didn’t fully read the release.

This is something which can be observed with a lot of these bonds. Information only gets priced in after a certain time lag. Something to look out for.

Quick news: WestLB results 2011 are out

Yesterday, West LB released its consolidated 2011 results.

On a Group level, the show a slightly negative result after tax. As discussed in the post about the Genußscheine, the relevant result for the finalpayout is however the “AG result”, which is the single company result of the holding company.

They don’t explicitly state the local GAAP result of the holding company, but they tell us the following:

Die Kapitalquoten im Konzern wurden durch das negative Jahresergebnis der WestLB AG auf HGB-Basis belastet. Die Kernkapitalquote betrug am Jahresende 8,8% (i. V. 11,4%), die Eigenmittelquote 13,8% (i. V. 15,9%). Die stillen Einlagen und das Genussrechtskapital der Bank nehmen gemäß den Emissionsbedingungen am handelsrechtlichen Bilanzverlust teil. Der Rückzahlungsanspruch beträgt nunmehr 85,1% für die Genussscheine und 82,9% für die Hybrid Tier 1 Anleihen aus dem Jahr 2005. Zudem unterbleibt für diese Instrumente vertragsgemäß die Zinszahlung für das Jahr 2011.

That means the payout for the Genußschein will be 85.1% plus the 2012 interest of around 2.9% or a total of 88%. This is a little less than in my base scenario, but still a relatively nice gain of around +42% for 10 months with a relativ small amount of risk involved..

Unfortunately, i don’t see too many similar opportunities at the moment.

Exotic securities: “Detachable GDP linked Greek warrant” – Valuation approach

In the first post i quickly looked at the features of the “Detachable GDP linked Greek warrant” (ISIN GRR000000010)

With securities like this, there are usually many ways to try to value this. You could eiher lock up a handfull of rocket scientists into an office and only let them out if they produce a model which is mind boggingly difficult, including at least features like “Monte Carlo simulation, path dependend barrier option etc.” or you can try a “common sense” approach to get a feeling about the risks and value drivers of such a complex structure. As anon-rocket scientist, I prefer the second one.

In order to get a rough idea how to evaluate this, we have to make sure to understand the following issues and risk factors:

Default risk

If Greece defaults, we don’t have to worry about GDP growth anymore. We should assume zero value (no recovery) in this scenario.

Maximum pay out

As discussed, the bond pays out a maximum of 1% on outstanding notional starting 2015. Based on the amortisation schedule (by the way: here is the Reg_S_Invitation_Memorandum1 GDP warrant starts at page 52) we can compute the best case cashflows:

Nominal Coupon max Payment in % of original amount
2012 100.0%    
2013 100.0%    
2014 100.0%    
2015 100.0% 1% 1.00%
2016 100.0% 1% 1.00%
2017 100.0% 1% 1.00%
2018 100.0% 1% 1.00%
2019 100.0% 1% 1.00%
2020 100.0% 1% 1.00%
2021 100.0% 1% 1.00%
2022 100.0% 1% 1.00%
2023 100.0% 1% 1.00%
2024 95.2% 1% 0.95%
2025 90.5% 1% 0.90%
2026 85.7% 1% 0.86%
2027 81.0% 1% 0.81%
2028 76.2% 1% 0.76%
2029 71.1% 1% 0.71%
2030 66.0% 1% 0.66%
2031 61.0% 1% 0.61%
2032 55.9% 1% 0.56%
2033 50.8% 1% 0.51%
2034 45.7% 1% 0.46%
2035 40.6% 1% 0.41%
2036 35.6% 1% 0.36%
2037 30.5% 1% 0.30%
2038 25.4% 1% 0.25%
2039 20.3% 1% 0.20%
2040 15.2% 1% 0.15%
2041 10.2% 1% 0.10%
2042 5.1% 1% 0.05%
2043 0.0% 1% 0.00%
       
Total     18.62%

So in the “perfect recovery case” and ignoring the option of the Government, the bond will pay out a maximum total of 18,62% of nominal value over its life.

Bond equivalent

If we then forget for a moment about the GDP triggers, we could calculate a market value for a bond with a fixed payement schedule resembling the best case of the GDP linker. For this we can use the current traded yield of the new greek Bonds, which is around 16% p.a.

Nominal Coupon max Payment in % of original amount NPV at 16%
2012 100.0%      
2013 100.0%      
2014 100.0%      
2015 100.0% 1% 1.00% 0.6%
2016 100.0% 1% 1.00% 0.6%
2017 100.0% 1% 1.00% 0.5%
2018 100.0% 1% 1.00% 0.4%
2019 100.0% 1% 1.00% 0.4%
2020 100.0% 1% 1.00% 0.3%
2021 100.0% 1% 1.00% 0.3%
2022 100.0% 1% 1.00% 0.2%
2023 100.0% 1% 1.00% 0.2%
2024 95.2% 1% 0.95% 0.2%
2025 90.5% 1% 0.90% 0.1%
2026 85.7% 1% 0.86% 0.1%
2027 81.0% 1% 0.81% 0.1%
2028 76.2% 1% 0.76% 0.1%
2029 71.1% 1% 0.71% 0.1%
2030 66.0% 1% 0.66% 0.0%
2031 61.0% 1% 0.61% 0.0%
2032 55.9% 1% 0.56% 0.0%
2033 50.8% 1% 0.51% 0.0%
2034 45.7% 1% 0.46% 0.0%
2035 40.6% 1% 0.41% 0.0%
2036 35.6% 1% 0.36% 0.0%
2037 30.5% 1% 0.30% 0.0%
2038 25.4% 1% 0.25% 0.0%
2039 20.3% 1% 0.20% 0.0%
2040 15.2% 1% 0.15% 0.0%
2041 10.2% 1% 0.10% 0.0%
2042 5.1% 1% 0.05% 0.0%
2043 0.0% 1% 0.00% 0.0%
         
Total     18.62% 4.23%

This table shows us, that the value of such a bond would be currently 4.23% based on the yields of the traded Greek Goevernment bonds

So let’s summarize this:

If the GDP linker would be a bond with a fixed payout amounting to the maximum payout of the discussed mechanism, its current value would be 4.23% of nominal value.

Next step: Assuming a “binary” option

Now just for fun, we could assume that the bond would only contain one option: If the first threshold is reached (2014 GDP 210 bn EUR, real 2014 yoy GDP growth of >= 2.34%) we could approx. work out the implied probabilityin current market prices.

So very simplistic (and mathematically not correct), with a curent price of the GDP warrant of ~0.80 % of nominal, the implied probability would be 0.80 EUR / 4.23 = 18.93% of achieving the required GDP scenario

Next step: More options !!!!!

As each years coupon payment of the bond depends independently on each years YoY real GDP growth, in theory each coupon would have to be valued as a seperate option. So theoretically, ignoring the nominal GDP hurdle, we have 29 single options packed into this security !!!

However, as we have seen in the second table, the options in the later year are worth almost nothing due to the high discount rate.

They payout itself is defined as the difference of the actual yoy GDP growth rate times 1.5 minus a reference GDP growth rate.

The reference rates are the following rates,the second colum shows the required rates for max.payout:

ref GDP yoy required for max
201400.00% 2.35% 2.23%
201500.00% 2.90% 2.60%
201600.00% 2.85% 2.56%
201700.00% 2.77% 2.51%
201800.00% 2.60% 2.40%
201900.00% 2.50% 2.33%
202000.00% 2.25% 2.16%
202100.00% 2.00% 2.00%

If we look at the Eurostat page, which publishes the relevant rate we can see that from 1996 until 2007, Greece had growth rates usually north of 3.5% with few exceptions. Interestingly they offer projections for 2012 and 2013 as well.

GDP hurdle: more fun

Maybe late at night during those negotiations an advisor thought: “hmm 29 different options with a non traded underlying is not difficult enough, so lets add some funky stuff !!!”.

As I described in the first post, no matter what the actual yoy growth rate looks like, the security only pays if certain nominal GDP thresholds are reached.

The thresholds are as follows:

year nominal GDP yoy
2014 210.1  
2015 217.9 3.71%
2016 226.4 3.90%
2017 235.7 4.11%
2018 245.5 4.16%
2019 255.9 4.24%
2020 266.47 4.13%
therafter 266.47 0.00%

To compare this with current data, I downloaded the GDP numbers directly from the official Greek statistical service, ELSTAT.

YEAR 2001 2002 2003 2004 2005 2006* 2007* 2008* 2009* 2010* 2011*
gdp 142 151 166 180 189 204 215 222 225 223 212

Interestingly, all numbers since 2006 are “provisional” whatever that means.

So in order to hit the nominal trigger, Greek GDP hast to reach 2011 levels in 2014.

Purchase Option

According to the prospectus, Greece has the “option” to purchase the warrants back. Howver this “option” isnot based on a fixed strike price but atrailing 30 day market price. Theoretically, an option at market price does not have any theoretical option value. However it introduces some “moral hazard” into the scheme. Greece could give a very bad outlook and then buy the Warrants back cheaply beforethen revising the outlook upwards.

So before this gets boring, let’s apply some common sense instead indulging in further quant dreams. In my opion one could think about the two main features as two “bets”:

A) Nominal GDP “bet”

This is basically a bet that Greece doesn’t fall in a deflationary trap and regains Nominal GDP around 2014.

B) Back to historical growth “bet”

This is the second bet that Greece goes back to historical growth and we get the full payout

In order to win this “game” one has to win both bets, winning only one is not enough.

If we further assume that the possibility of a Greek bankruptcy is independently reflected in our calculated discounted cash flows, we can value the security in the following way:

Probability of “Nominal GDP bet” times probability of “Historical growth bet” times NPV of max payout

With this assumption one can calculate a very simple valuation grid based on the NPV of 4.23% for the maximum payout:

Nominal bet        
Back to Growth 10% 20% 30% 40% 50%
10% 0.04% 0.08% 0.13% 0.17% 0.21%
20% 0.08% 0.17% 0.25% 0.34% 0.42%
30% 0.13% 0.25% 0.38% 0.51% 0.63%
40% 0.17% 0.34% 0.51% 0.68% 0.85%
50% 0.21% 0.42% 0.63% 0.85% 1.06%

So the picture is relatively clear: Only if one asumes for both, the non-deflation scenario and the return to historical growth bets a chance of 40-50% EACH, then the current market prices of around 80 cents might makes sense.

Personally, I don’t see the returns to historical growth rates any time soon, although I might accept a chance of maybe 50% that they can reach the nominal target.

At the moment, I would not buy this at any price. I think this is one of the securities which will “sleep” for a long time eventually die or maybe become interesting in 5 years when everyone has forgotten about them and Greece for some reason avoided bankruptcy again and one can get this for virtually nothing.

Edit:Some changes made with regard to the GDP growth formula and the repurchase option.Thanks to Dante for reminding me.

Exotic securities: “Detachable GDP linked Greek warant” (ISIN GRR000000010)

Yiiihaaa, this Monday was the first day this “beauty” is trading. As mentioned before, this is a security which is part of the “PSI package”.

As one could expect, this security is mind boggingly complex. As far as I understand, the features are as follows:

1. The max payout is 1% per year based on the nominal value
2. the first potential payment date will be 15th October 2015
4. The nominal Value will amortise after year 2022 to zero in year 2043
3. In order to trigger the payout, two principle conditions have to apply (apart from Greece not being not bankrupt)
a) the greek GDP has to be abvove a certain specified nominal amount
b) the growth rate of the real Greek GDP has to be aboev a certain specified rate
4. The Greek Government can “call” the warrants anytime from 2020 on based on a 30 day trailing market price

The specified nominal GDP hurdle for 2014 is 210 billion and increases to 260 bn EUR in 2020. Through Google I found an estimated GDP number for 2011 of 310 bn USD or ~ 238 mn EUr for 2011, so they could shrink further to a certain extent and still be above the trigger. Currently, GDP shrinks at -5.5 nominal rate. Two years with this rate would bring as very close to the trigger level.

The required real growth rates are in the area of ~2.35 to 2.8% in the first few years and then 2% thereafter.

I haven’t built a model yet, but from a theoretical point of view it will be a really fun exercise.

Market prices:

On monday the first trades on the German Exchange were ~1.25 % of nominal value, at the moment small lots are traded at 0.95 EUR. The lowest trades were executed at 0.85 EUR. The broker quotes I see are something like 0.75/1.00 so the banks don’t seem to be keen to make a market.

So let’s wait and see how this develoipes. In any case I always find it big fun to look at such “exotics”….

Exotic securities: (True) perpetual Portuguese Government bonds

As some readers know, I have a weakness for “exotic” securities. Those are usually fixed income securities with some uncommon features.

As now Portugal looks like the next Greece, I just had a quick look at Portuguese Government bonds. If one wants to speculate on a potential recovery, the longer dated Govies are usually the better bet, as we have seen in Greece, the haircut is the same for every bond, irrespective of the marurity. However the upside is usually a lot better for long dated bonds (if they survive).

When I checked the long dated Portuguese bonds, I was genuinely surprised:

Portugal has some “true” perpetual bonds outstanding, which I only know from history (I think the UK has some as well).

There seem to be four different series, all issued in the 1940ies during WWII:

– 4.00%, issued 1940 (ISIN PTCON4OE0005)
– 3.50%, issued 1941 (ISIN PTCON1OE0008)
– 3.00%, issued 1942 (ISIN PTCON2OE0007)
– 2.75%, issued 1943 (ISIN PTCON3OE0006)

As far as I could see, the bonds are traded irregulary on the Lisbon stock exchange (LSE), however pricing is quite volatile and amounts (if any) are small. Bid ask is currently somethin like 25/36 for the 2.75% bond ….

For the 4% bonds there were some “real” trades at around 24-25% in January and February. This would be an attractive price if one could get it.

It would be intersting to see if one could actually buy those bonds on the stock exchange. I am also not sure what nominal values those bonds have. A quick Google search didn’t provide any meaningful results.

So as a summary:

It is nothing to invest into right now, but something to look closer, especially if the situation in Portugal gets more severe.

« Older Entries