Tag Archives: Ted Weschler

Home Capital Group (HCG) – Contrarian Opportunity in Canada after being rescued by Buffett ?

hcg-logo-200x72

Background:

Home Capital Group is a Canadian bank/mortgage lending company founded in 1986 and run by the same CEO for 30 years, which came into the spotlight over the past few months. It ran into trouble, almost imploded and then got saved by no one other than Warren Buffett (and Ted Weschler).

There is good coverage following this link. The story in short:

Home Capital wanted to aggressively expand into insured mortgages. However at least one underwriter collaborated with mortgage brokers to get mortgages approved without proper documentation. At some point regulators reigned in but management did not tell shareholders about it. Then the regulator got tough and management had to go. In the meantime, short-term financing was pulled and the company got into real liquidity troubles.

Read more

Quick check: John Deere (DE) – Great “cannibal” or cyclical trap ?

Looking at Berkshire’s portfolio is clealry a “must” for any value investor. Whenever they disclose a new stake it makes clearly a lot of sense to look at least briefly at what they are buying. Berkshire disclosed the John Deere position in late February this year. I assume this is a “Ted & Todd” stock. Looking at the track record of Berkshire’s public holdings, this is actually a good sign as Ted&Todd have beaten the “master” now several years in a row.

Looking quickly at Deere, it is not difficult to see some of the attractions:

+ relatively cheap (trailing P/E of 12,6, Stated EV/EBITDA of 5,5, EV EBIT 7)
+ organic growth, low Goodwill, good profitability in the past
+ good strategy /incentives in place
+ solid business model, significance of dealer network (quick repairs during harvest season…)
+ “Cannibal”, is massively buying back stocks

Especially the massive share buy backs are clearly a common theme for “Ted&Todd stocks”. Starting in 2014, Deer has reduced the sharecount constantly from around 495 mn shares to now ~344 mn shares.

However we can also see quickly a few “not so nice” things at Deere:

– pension /health liabilities (health – how to value ? 6bn uncovered. Very critical, healthcare sunk GM, not pension (EV multiples need to be adjusted for this)
– they do not cancel shares, held as “treasury”, why ?
– Financing business –> receivables & ROA most likely not “true”..
– lower sales but higher financing receivables ? Channel stuffing ?
– comprehensive income to net income volatility
– cyclical business. current profit margins still above historical average

Financing business

One of the most interesting aspects of John Deere is clearly the financing business. As other companies they offer financing, here mostly to dealers and not to the ultimate clients. A financing business is nothing else than an “in-house bank”, sharing much more characteristics with a financial than a corporate business, for instance requirement of continuous capital market access, default risk etc.

What I found especially interesting is the following: looking at Bloomberg, they already strip out automatically all the debt from the financing business when they show EV multiples. This could be OK if the debt is fully non-recourse however I am not so sure with Deere. Although they not explicitly guarantee the debt, there seems to be some “net worth maintenance” agreement in place which acts as a defacto guarantee for the debt.

An additional important point is the following: Deere shows very good profitability on capital in its “core” business. However, this is partly due to the fact that they show almost no receivables in the core segment. the receivables are indirectly shown in the financing business. To have the “true” ROIC or ROCE, one would need to add back several months of receivables to the core segment in my opinion.

Cyclical aspect: Corn prices

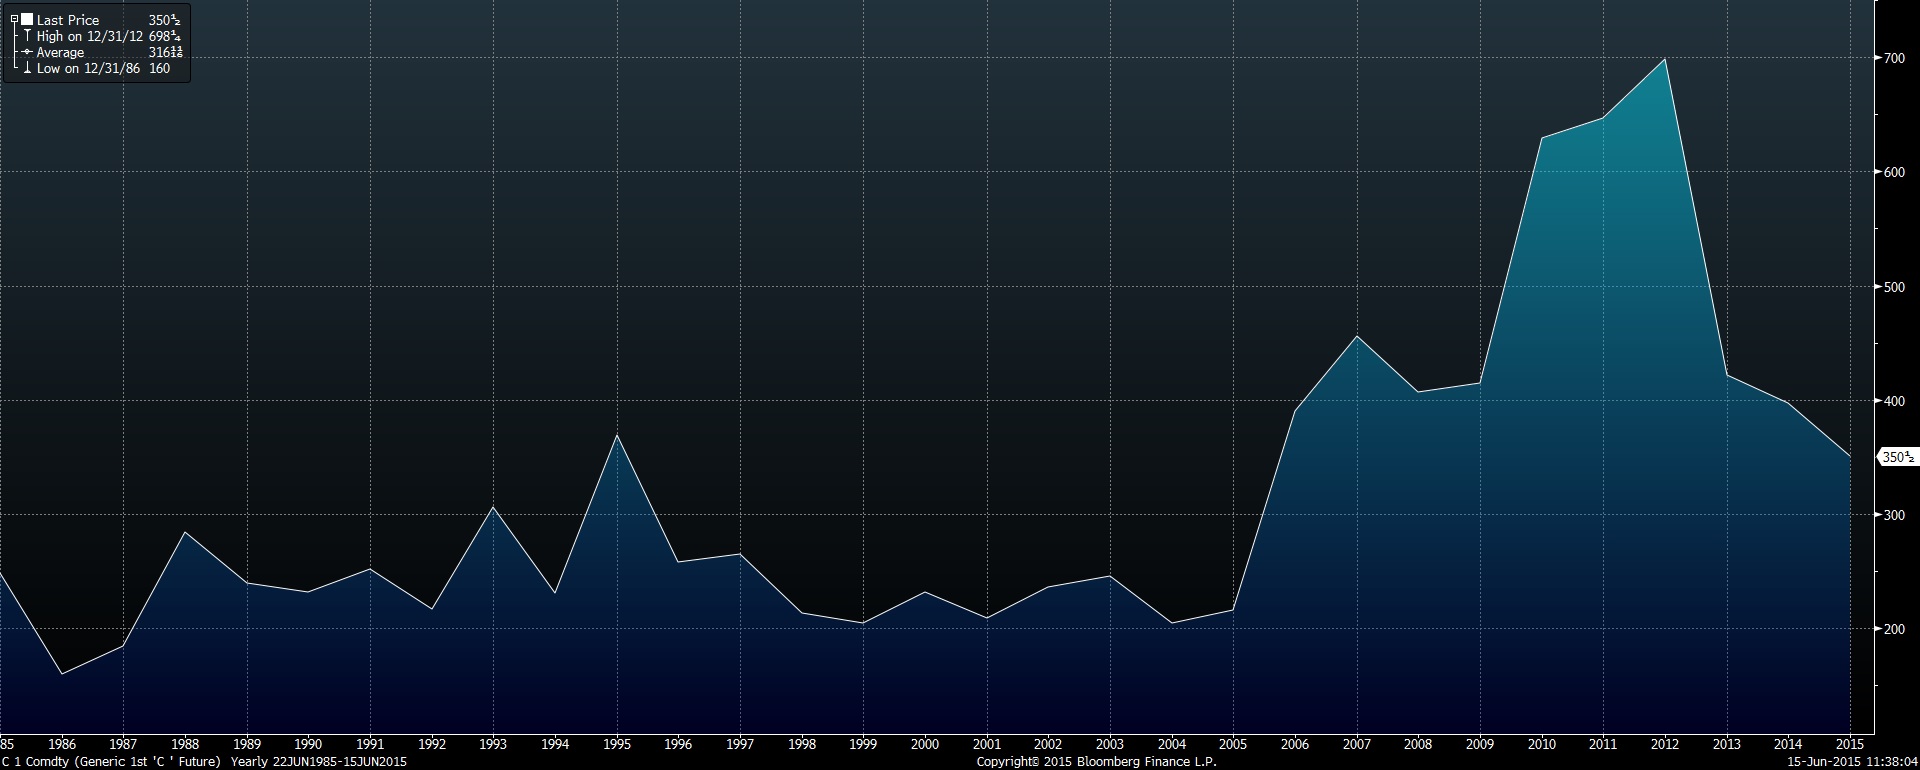
This is a 35 year chart of annual corn prices:

corn annual

We can clearly see that corn prices went up dramatically in around 2006 but are dropping since 2013 back to their historical levels. Demand for farm equipment is pretty easy to explain: If you make a lot of money on your harvest, you have money to spent for a new tractor (with a small time lag).

This is the 17 year history of Deere’s net margins:

Net margin
31.12.1998 7,52%
31.12.1999 2,08%
29.12.2000 3,76%
31.12.2001 -0,49%
31.12.2002 2,32%
31.12.2003 4,17%
31.12.2004 7,04%
30.12.2005 6,89%
29.12.2006 7,82%
31.12.2007 7,68%
31.12.2008 7,32%
31.12.2009 3,78%
31.12.2010 7,17%
30.12.2011 8,75%
31.12.2012 8,48%
31.12.2013 9,36%
31.12.2014 8,77%
Avg total 6,02%
Avg 2006-2014 7,68%
Avg. 1998-2005 4,16%

So it is quite interesting to see, that in the 7 years before the “price explosion” of corn, margins were quite volatile and around 4,2% on average. In the last 9 years however, the average jumped to 7,7% with 2014 being still above that “high price period” average.

Clearly, Deere doesn’t only sell to corn farmers, but many other agricultural prices have faced similar declines.

To be honest: I do not know enough if Deer can maybe keep the high margins they are enjoying currently, but to me at least the risk of margin mean reversion is pretty high for such a cyclical business.
Even if we assume mean reversion only to the overall average of ~6%, this would mean around 6 USD profit per share which seems to be currently also the analyst consensus.

Summary:

For me, despite a lot of positive aspects, John Deere is not an attractive investment at the moment. Despite being well run, the business is cyclical and has profited from high crop prices in the past. The balance sheet is not as clean as I like it and the valuation is not that cheap if we factor in pensions and the financing arm. Clearly the stock looks relatively cheap to other US stocks but the risks are significant. Maybe there is more if one diggs deeper (network moats via dealers etc.) but for the time being I will look at other stuff. At an estimated 2015 P/E of 16-17, there are many opportunities which look relatively speaking more attractive and where I can maybe gain a better “informational advantage” than for such a widely researched stock.

Edit: By the way, if someone has a view on the moat / brand value of John Deere I would be highly interested……

Berkshire Hathaway 2012 listed stocks performance

I hope everyone has now read the 2012 annual Berkshire Letter which came out last week.

Among other stufff, Warren Buffet complained a little bit that he didn’t beat the S&P 500 based on the increase in Book Value at Berkshire.

Just for fun, I hacked in Berkshire portfolio.

In a first step I looked at all the disclosed positions above 1 bn USD.

2012 perfomance P/E P/B EV/EBIT EV/EBITDA Beta Volume
American Express 23.57% 14.7 3.8 16.1 8.9 1.05 8,715
Coca Cola 6.51% 19.6 5.3 16.6 14.0 0.72 14,500
Conoco Philips 9.20% 9.5 1.5 6.5 4.4 0.98 1,399
Direct TV 17.31% 10.8 #N/A N/A 9.0 6.2 0.89 1,154
IBM 4.17% 13.7 12.4 11.6 9.4 0.91 13,048
Moody’s 51.86% 16.6 29.1 10.3 9.5 1.31 1,430
Munich Re 54.71% 8.1 1.0 #N/A N/A #N/A N/A 0.94 3,599
Philips 66 50.41% #N/A N/A 2.0 10.8 8.5 1.16 1,097
POSCO 1.19% 8.3 0.7 9.0 6.4 1.01 1,295
Procter & Gamble 5.18% 19.4 3.2 14.4 11.9 0.64 3,563
Sanofi 34.20% 20.0 1.7 13.2 6.9 0.76 2,438
Tesco -8.20% 10.8 1.7 10.4 7.2 0.72 2,268
US Bancorp 20.96% 11.9 1.9 #N/A N/A #N/A N/A 1.09 2,493
Walmart 16.97% 14.6 3.2 10.3 7.9 0.59 3,741
Wells Fargo 27.37% 10.7 1.3 #N/A N/A #N/A N/A 1.15 15,592
 
Total / Avg 17.56% 14.27 5.0 13.4 10.1 0.92 76,332

To add some value, I have added some valuation metrics and aggregated the performance based on year end values. Although this is not the 100% correct way to do this, we can see that the listed stock portfolio outperformed the S&P Total return index (+14.1%) by a margin of almost 3.5%. A very respectable outperformance for a 75 bn USD portfolio. One can also see that the Beta of the portfolio is clearly below 1, so the outperformance really looks like alpha. (EDIT: I do not know which Index Buffet used for his 16%, I took S&P 500 total return performance from Bloomberg).

From simple valuation metrics, the portfolio of course looks quite expensive. P/E of 14.4 is in line with the S&P 500, but it looks like that Berkshire doesn’t consider P/B as a meaningful metric for listed stocks anymore. Also, the average EV/EBIT of 13 and EV/EBITDA of 10 is far above I would be prepared to pay.

In a second step, I added all the stock positions which were disclosed by Berkshire plus anything available on Bloomberg with a value of more than 200 mn USD.

2012 perfomance P/E P/B EV/EBIT EV/EBITDA Beta Volume
American Express 23.57% 14.7 3.78 16.05 8.88 1.05 8,715
Coca Cola 6.51% 19.6 5.33 16.55 13.98 0.72 14,500
Conoco Philips 9.20% 9.5 1.47 6.54 4.38 0.98 1,399
Direct TV 17.31% 10.8 #N/A N/A 9.03 6.16 0.89 1,154
IBM 4.17% 13.7 12.41 11.56 9.41 0.91 13,048
Moody’s 51.86% 16.6 29.11 10.29 9.48 1.31 1,430
Munich Re 54.71% 8.1 0.96 #N/A N/A #N/A N/A 0.94 3,599
Philips 66 50.41% #N/A N/A 1.98 10.82 8.52 1.16 1,097
POSCO 1.19% 8.3 0.70 8.96 6.36 1.01 1,295
Procter & Gamble 5.18% 19.4 3.21 14.44 11.88 0.64 3,563
Sanofi 34.20% 20.0 1.74 13.22 6.88 0.76 2,438
Tesco -8.20% 10.8 1.74 10.40 7.15 0.72 2,268
US Bancorp 20.96% 11.9 1.86 #N/A N/A #N/A N/A 1.09 2,493
Walmart 16.97% 14.6 3.21 10.27 7.86 0.59 3,741
Wells Fargo 27.37% 10.7 1.33 #N/A N/A #N/A N/A 1.15 15,592
               
Davita 45.80% 19.4 3.33 14.95 11.94 0.80 1,830
Swiss Re 49.31% 6.8 0.92 #N/A N/A #N/A N/A 1.15 909
Washington Post 1.20% 17.6 1.16 9.27 4.52 0.81 704
General Motors 37.40% 9.3 1.47 #N/A N/A 1.31 1.19 697
M&T Bank 31.99% 13.7 1.43 #N/A N/A #N/A N/A 1.07 558
BonY Mellon 30.69% 12.2 0.92 #N/A N/A #N/A N/A 1.28 544
Costco 26.15% 24.8 3.50 13.49 10.21 0.75 444
USG 166.24% #N/A N/A 502.76 48.17 18.47 2.14 472
Viacom 16.92% 14.5 4.21 9.25 8.70 1.16 459
Precision Castparts 12.83% 20.3 2.92 15.23 13.93 0.92 374
Mondelez 6.24% 12.7 1.58 9.46 7.81 0.62 366
National Oilwell -0.76% 11.5 1.43 8.19 6.96 1.51 357
Deere 11.80% 11.2 4.67 8.22 6.75 1.14 355
Wabco 43.46% 14.4 6.48 12.46 10.07 1.72 281
General Dynamics 6.04% 10.6 2.10 30.15 17.28 0.97 262
Visa 47.56% 24.6 4.68 18.01 17.09 0.98 250
Torchmark 18.82% 11.2 1.25 #N/A N/A #N/A N/A 0.97 245
Mastercard 29.89% 23.9 9.38 14.04 13.27 1.00 214


Total / Avg 19.57% 14.4 7.6 13.6 10.1 0.94 85,653

A few observations here:

I do not understand, why DaVita was not included in the shareholder’s letter with a market value of 1.8 bn. Maybe they have forgotten this position ?

Secondly, including those additional ~10 bn of stocks increases the total performance of the total portfolio by an incredible 2%.

In a third step, I calculated the performance of what I would call the “Non Buffet” Portfolio, taking Direct TV from the annual letter and eliminating Swiss Re and Washington Post from the < 1bn list.

2012 perfomance P/E P/B EV/EBIT EV/EBITDA Beta Volume
               
Direct TV 17.31% 10.8 #N/A N/A 9.03 6.16 0.89 1,154
Davita 45.80% 19.4 3.33 14.95 11.94 0.80 1,830
General Motors 37.40% 9.3 1.47 #N/A N/A 1.31 1.19 697
M&T Bank 31.99% 13.7 1.43 #N/A N/A #N/A N/A 1.07 558
BonY Mellon 30.69% 12.2 0.92 #N/A N/A #N/A N/A 1.28 544
Costco 26.15% 24.8 3.50 13.49 10.21 0.75 444
USG 166.24% #N/A N/A 502.76 48.17 18.47 2.14 472
Viacom 16.92% 14.5 4.21 9.25 8.70 1.16 459
Precision Castparts 12.83% 20.3 2.92 15.23 13.93 0.92 374
Mondelez 6.24% 12.7 1.58 9.46 7.81 0.62 366
National Oilwell -0.76% 11.5 1.43 8.19 6.96 1.51 357
Deere 11.80% 11.2 4.67 8.22 6.75 1.14 355
Wabco 43.46% 14.4 6.48 12.46 10.07 1.72 281
General Dynamics 6.04% 10.6 2.10 30.15 17.28 0.97 262
Visa 47.56% 24.6 4.68 18.01 17.09 0.98 250
Torchmark 18.82% 11.2 1.25 #N/A N/A #N/A N/A 0.97 245
Mastercard 29.89% 23.9 9.38 14.04 13.27 1.00 214
               
               
Total / Avg 34.97% 15.2 33.6 15.3 9.9 1.07 8,862

And here we can see that Weschler and Combs really “shot out the lights”. 35% performance for 2012 is a fxxxing fantastic result. Ok, Beta is slightly above 1 but at least for 2012 the did a outstanding job. No wonder Buffet said that in his annual letter:

Todd Combs and Ted Weschler, our new investment managers, have proved to be smart, models of integrity, helpful to Berkshire in many ways beyond portfolio management, and a perfect cultural fit. We hit the jackpot with these two. In 2012 each outperformed the S&P 500 by double-digit margins. They left me in the dust as well.

So even if some of the smaller stocks are “Warren & Charlie” stocks as well, Weschler and Combs showed them how its done at least with a smaller portfolio. Maybe the smaller size of the portfolio is the reason ?

Summary:

Once again, the portfolio of listed stocks of Berkshire outperformed the S&P 500 by a nice margin. However it seems to be that Buffet’s “elephants” don’t have a chance against the smaller holdings of Weschler and Combs. Nevertheless, for the “lazy” value investor, copying the Berkshire portfolio looks still like a winning strategy.

Copying the “small” Berkshire stocks however looks like the absolute killer strategy.