At the moment, the Japanese Stock marketseems to be “red hot”. Finally, after 25 years or so, Japanese stock seem to be one of the top stories. Honestly, I do not really understand why. Despite the Japanese Finance Minister targeting actual Nikkei levels, I was quite disappointed when I ran a couple of Japanese stocks through my “Boss” screen.
Although many Japanese companies trade at significant discounts to book value, the problem is with Japanese companies that their returns on book value are extremely low. Many companies over time even are actively destroying value. Dividend payouts are extremely low and shareholder activism is not really an option for Japan Inc.
Out of curiosity, I started to screen Korean companies with my BOSS model as well. Before jumping into the list of the most interesting companies, let’s review a few facts about South Korea:
Somehow “under the radar”, South Korea has been one of the most succesful economies over the last 20-30 years. Even the Asian crisis could not stop the South Korean economy from growing at around 5% p.a. since 1990.
The countries’ economic position compared to Japan is very healthy, Debt/GDP is only 30%, the Government currently runs a surplus and the current account is of course positive.
Korean stock market
According to Bloomberg, there are currently 1973 traded stocks. Interestingly, this means that there are 600 more traded stocks than in Germany. The market cap of the major Index KOSPI is ~1.100 trillion won or around 760 bn EUR, almost equal to the German CDAX (820 bn EUR) or 2 times Apple…..
20% of the Index alone is giant Samsung electronics, followed by Huyndai with 4.3% and Posco at around 3% index weight. For some reason, Bloomberg shows a trailing P/E of 26 for the Kospi, however the forward P/E is estimated at 10.3. Price Book is a cheap 1.1, dividend yield only 1%.
First results from the Boss model
So far, I have added 160 South Korean stocks to my database. The first results are quite interesting. Sorted by the 10 Year Boss Score, i get the following Top 20 stocks:
Name
BOSS 10Y
BOSS 5Y
MI CHANG OIL INDUSTRIAL CO
436.0%
577.2%
KYEONG NAM STEEL CO LTD
403.0%
262.9%
SEOUL CITY GAS CO LTD
324.5%
226.0%
POSCO
304.1%
235.7%
GS ENGINEERING & CONSTRUCT
272.8%
199.1%
INDUSTRIAL BANK OF KOREA
258.6%
199.9%
OCI MATERIALS CO LTD
255.0%
403.8%
KYUNGDONG CITY GAS CO LTD
230.4%
270.7%
NICE INFORMATION & TELECOM
229.5%
185.0%
SAMYOUNG M-TEK CO LTD
219.1%
227.9%
HANNET CO LTD
217.9%
154.4%
MK ELECTRON CO LTD
213.1%
190.2%
FURSYS INC
206.9%
125.6%
WONPOONG CORPORATION
205.5%
227.0%
HANIL CEMENT CO LTD
201.5%
103.4%
KORTEK CORP
200.5%
213.3%
WISCOM CO LTD
197.8%
284.7%
SAMYANG GENEX CO LTD
191.9%
65.3%
KYUNGDONG PHARM CO LTD
190.9%
135.4%
BUSAN CITY GAS CO LTD
184.6%
185.4%
I only superficially checked the companies, but some look interesting:
MI CHANG OIL INDUSTRIAL according to Bloomberg seems to be the Korean Fuchs Petrolub, Fidelity is owning 10%.
KYUNGDONG PHARM CO LTD has among its shareholders Delta Lloyd (10%) and Baupost (5%)
Foreign shareholders
One of the big issues with Korean stocks is that only very few of them are listed outside Korea. Out of the top 20, I only found Posco with a meaningful foreign listing. It seems to be possible however to open a Korean trade account as a foreigner. E-Trade Korea for instance seems to offer this service but I haven’t tried contacting them yet.
Anyway, I think I will need to do some more research into Korean stocks but I think the list is already a very good point to start.
As discussed last week, KPN might become a potentially interesting “special situation” because of its announced massive equity raising.
In any case it makes sense to look a little bit deeper into KPN, even if it would be only a “short-term” special situation invest.
Relative valuation
let’s look at some standard valuation metrics:
Name
P/B
P/E
Dvd Ind Yld
EV/EBITDA T12M
EV/MC
KONINKLIJKE KPN NV
1.88
6.47
3.81
3.80
3.79
DEUTSCHE TELEKOM AG-REG
1.46
8.04
4.28
2.22
BELGACOM SA
2.30
9.45
7.74
4.98
1.26
FRANCE TELECOM SA
0.76
5.63
17.49
3.81
2.60
BT GROUP PLC
9.78
3.26
5.02
1.41
VODAFONE GROUP PLC
1.23
5.67
8.20
1.34
TELIASONERA AB
1.72
9.51
6.56
7.28
1.35
PORTUGAL TELECOM SGPS SA-REG
1.55
17.25
15.71
5.43
3.23
SWISSCOM AG-REG
5.05
11.92
5.49
7.09
1.39
TELECOM ITALIA SPA
0.55
6.39
4.11
3.99
TELE2 AB-B SHS
2.20
13.92
6.91
5.95
1.34
TDC A/S
1.54
8.99
11.23
5.39
1.69
TELENOR ASA
2.53
41.85
4.20
5.65
1.20
TELEFONICA SA
2.19
7.37
5.29
2.41
ILIAD SA
5.04
42.03
0.27
11.09
1.14
TELEKOM AUSTRIA AG
2.53
3.75
2.39
KPN looks relatively cheap based on some metrics, especially P/E and EV/EBITDA. However we can also see that KPN is one of the TelCo companies with the highest debt loads. I used here´EV divided by market cap, but one could also use simple debt/equity ratios.
What is interesting to see is for me that despite the very weak performance of the sector, price/book is still relatively high for most of the companies. I think this is a result of the high dividends being paid by the TelCos which “eroded” book equity.
KPN history
In the case of KPN, things look a little bit different. If we look at this first set of numbers, dividends don’t’ seem to be the problem:
EPS
DIV
BOOK Value
31.12.2002
-3.94
#N/A N/A
1.83
31.12.2003
1.11
#N/A N/A
2.90
31.12.2004
0.72
0.16
2.69
30.12.2005
0.66
0.40
2.36
29.12.2006
0.79
0.48
2.19
31.12.2007
1.42
0.52
2.51
31.12.2008
0.77
0.56
2.18
31.12.2009
1.33
0.63
2.36
31.12.2010
1.15
0.73
2.23
30.12.2011
1.06
0.81
2.05
If we exclude 2003 (which contained the losses from the 3G licence excesses), KPN paid out only ~45% of its earnings as dividends. So what happened ?
This becomes clearer if we look at the next tabel, which shows free cash flow, net debt per share and outstanding shares:
FCF p. Share
Net debt per share
Shares outstanding
31.12.2002
1.17
4.99
2,491
31.12.2003
1.08
3.37
2,491
31.12.2004
0.91
2.90
2,410
30.12.2005
1.16
3.82
2,151
29.12.2006
1.31
4.32
2,036
31.12.2007
1.35
5.92
1,843
31.12.2008
1.21
6.32
1,714
31.12.2009
1.23
6.56
1,629
31.12.2010
1.54
7.45
1,573
30.12.2011
1.66
8.46
1,478
So we can easily see that until recently, KPN looked like the classical “anglo saxon style” shareholders dream: Fat free casflows used together with increasing debt to repurchase around 40% of their outstanding shares since 2003.
Looking at the stock chart, this seemed to help KPN to outperform for instance Deutsche Telekom for a long time, but now finally they both seem to have met at the bottom again:
So one lesson one can learn here is that being a “cannibal” company does not mean automatically that this will be a good investment. Based on a rough calculation, KPN had purchased around 10 bn EUR of its own shares between 2003 and 2011, nevertheless, the market cap of the company remained more or less constant over this period in time.
So looking back, this share repurchase looks rather like a debt financed liquidation than a value enhancing share buy back.
Debt profile
Having so much debt, it makes sense to look at the maturity profile of KPN.
Payments
Principal Only
Year
Amt(Mln)
2013
1,085
2014
1,400
2015
1,000
2016
1,250
2017
1,000
2019
1,046
2020
1,000
2021
1,250
2022
750
2024
700
2026
473
The table shows, that KPN has quite some debt to roll. So far they still have investment grade ratings (Baa2 from Moody’s, BBB- from S&P). Moody’s has them on negative outlook, S&P on stable.
The problem seems to be S&P. Despite having a BBB- rating on long term debt, S&P has them as “A-3” short term, which is the second worst rating available in the short term rating scale. This means effectively that KPN is shut out of short term financial markets as there are only a very small number if institutions permitted to buy such low grade paper. Even Telekom Italia still has an A-2 rating.
Especially the December S&P report clearly outlines some of the most important weaknesses of KPN. An interesting aspect is that one:
That said, the group is facing intense pressures on its domestic mobile revenues in particular, owing to the cannibalization of consumer revenues by IP-based instant messaging applications.
I have read that several times, that mobile carriers made most of their money with SMS. Now however, applications like “What’s App” are eating their lunch because they just use the internet flat fee, effectively eliminating the need to send SMS. As always, the established players were much to slow to react to this threat and I guess that now it is already to late.
KPN seemed to have identified this threat quite early and according to this article tried to increase fees for those services, but this actually resulted in a backlash called “net neutrality”. So The Netherlands and Chile are now the only 2 countries with full “net neutrality” which means the following:
The new law requires companies providing access to the Internet to treat all Internet services equally. They cannot favor their own services, nor charge extra to access a competitor’s service.
I guess this is one of the reasons why they earn higher margins in Germany as number 4 than as market leader in the Netherlands.
Another interesting point here:
If one reads the S&P anaylsis carefully, their major issue seems to be the 1.5 bn spectrum purchase which they think seems to be expensive. The big question here is:
Why does KPN target 4 bn as a capital increase although the rating agency problem seems to be a lot smaller ?
In my opnion, both the amount and the way to raise capital does not make sense. Why don’t they try to to the same as Telefonica and list a minority stake of their German business on the stock exhange ? With an EBITDA of almost 1.3 bn EUR of E-Plus in Germany, a 49% stake could easily raise 2-3 bn EUR on the basis of the Telefonica Dutschland valuation. This would be more than enough to resolve the rating issue and secure roll over of debt.
After being quite shareholder friendly over the last 8 years or so, suddenly, they don’t seem to care any more for shareholders. This is something which really worries me.
One explanation could of course be that they want to annoy or shake off Carlos Slim as large shareholder. In my opnion, this looks like the most likely reason why they behave in such a way. This howver would present exactly the short term opportunity I would be looking for. Management acting irrationally could open up an interesting sitauation, once the capital increase is being executed.
The other explanation would be that management sees a lot mor bad news coming and want to build up a cushion for big future losses. This would be bad.
Summary:
Honestly, I would not want to own KPN as a long term investment, however I will watch the situation carefully especially if they are going through with a deeply discounted issuance price. If the shareprice than will go down close to the discounted issuance price, there migth be a good “special situation” opportunity.
I had briefly covered deeply discounted rights issue as a potential “special situation” opportunity a couple of weeks ago.
Now, with KPN, we have an interesting non-financial candidate. This is what KPN issued today:
Dutch telecoms group KPN confirmed a €4bn rights issue to shore up its capital position after heavy expenses on bandwidth that have led to dividend cuts and lower profit margins.
The company announced the move along with its 2012 annual results, which showed a 3.5 per cent drop in revenues and a 12 per cent fall in earnings from the year before.
As one might expect, the stock tanked some 16% or so. Currently, at around 3.45 EUR per share, KPN has a market Cap of only 5 bn EUR, so raising 4 bn via a rights issue might require a large discount on potential new shares.
The “wild card” in this game will be Mexican Billionaire Carlos Slim who owns currently 27.5% of the company. If he fully participates as lead investor and even taking up more than his share, then the “forced selling” aspect might not be too relevant.
If for some reason, he would refuse to participate, the situation will become very interesting.
Just for fun, let’s look how the performance was for Unicredit. I would distinguish the following events / time periods:
– 4 weeks before announcement
– announcement day
– period between announcement and price setting (for new shares)
– price setting day
– period between price setting and start trading of subscription rights
– trading period
– 4 weeks after end of trading period
First the relevant dates:
Unicredit
Announcement first trade date
14.11.2011
Price setting of rights issue
04.01.2012
First trade date subscr. rights
09.01.2012
Subscription trading until
01.02.2012
Discount
43%
New share
2 new for 1 old
Now the relative performance:
Performance
UCG
MIB
Relative
– 4 weeks before announcement
-18.35%
-4.98%
-13.37%
– Date of announcement
-6.18%
-1.99%
-4.19%
– announcement until price setting
-14.40%
2.95%
-17.35%
– day of price setting
-17.27%
-3.65%
-13.62%
– price setting to start trading
-26.46%
-4.45%
-22.01%
– trading period
73.75%
12.94%
60.81%
– 4 weeks after trading period
0.05%
2.82%
-2.77%
– 6 months after trading period
-32.25%
-11.39%
-20.86%
– 12 months after trading period
12.53%
9.53%
3.00%
In the Unicredit example, clearly the period where the subscription rights were traded showed the best relative performance of the shares. Interestingly, on the announcement day, the price drop was much less in percentage points than KPN. This might have to do with the short selling ban which was in place (at least to my knowledge) when Unicredit announced the rights issue.
Again for fun, a quick look at Banco Popular’s rights issue from the end of last year.
Again the dates first:
POP
Announcement first trade date
01.10.2012
Price setting of rights issue
10.11.2012
First trade date subscr. rights
14.11.2012
Subscription trading until
28.11.2012
New share
3 new for 1 old
and then relative performance to the IBEX:
Performance
POP
IBEX
Relative
– 4 weeks before announcement
-3.95%
5.11%
-9.06%
– Date of announcement
-6.17%
0.98%
-7.15%
– announcement until price setting
-29.95%
-1.71%
-28.24%
– day of price setting
4.56%
-0.90%
5.46%
– price setting to start trading
-8.86%
1.39%
-10.25%
– trading period
8.12%
2.16%
5.96%
– 4 weeks after trading period
-6.71%
3.74%
-10.45%
One can see a similar pattern first, with the stock losing 4 weeks before announcement, as well as on the announcement date until the final price setting. However of the date of price setting, the stock jumped, until loosing only a little bit until starting of the trading period.
Then however, the gains within this period were relatively low compared to Unicredit. Overall it looks a lot less volatile than Unicredit, so maybe less forced selling here.
Back to KPN:
Other than Unicredit and Banco Popular, KPN had outperformed the AEX almost +11% in the last 4 weeks, so today’s large drop might compensate for this (unjustified) outperformance.
If the other two stocks are any guide, one could still expect lower prices until the price for the new shares will be set.
The stock price of KPN look really really ugly long term:
But make no mistake, any company which needs to go into deeply discounted rights issues is in trouble. This is “distressed” territory.
I started my small 2013 utilites project with E.On 2 weeks ago. Instead of working through the list of German utilities I wanted to focus on Swiss listed Energiedienst Holding AG first.
Energiedienst is a slightly unusual stock. It is listed on the Swiss stock exchange, but its balance sheet is in EUR. The company basically runs a number of big Hydro power plants along the Rhine River plus some smaller Hydro Power plants in Southern Germany and Switzerland as this map shows:
From a simple valuation point of view, Energiedienst does not look overly attractive, however one should mention that they do have net cash which is quite uncommon for utilities.
The company is majority owned by German ENBW (67%) plus a company called “Services Industriels de Genève (SIG)” which bought a 15% stake in 2011 from ENBW (remark: ENBW itself is in quite big trouble because of the Nuclear exit in Germany).
Business model
In addition to the Hydro plants, Energiedienst owns a distribution network with around 750 tsd clients in Switzerland and Southwestern Germany. The focus is clearly Germany with more than 80% of sales there. Energiedienst produces around 25% of its energy itself, the rest is bought in the market.
The interesting point is that their own electricity production is almost 100% Hydro power. Hydro power, in contrast to power from fossil fuel, is more or less a pure fixed cost business. You build the hydro plant, depreciate and that’s it. If electricity prices go up, you earn more, if they go down you earn less. You don’t have to worry about oil or coal prices. On the flip side, hydro power depends on the amount of water available, so in dry years you can produce less or more in wet years which introduces some uncertainty.
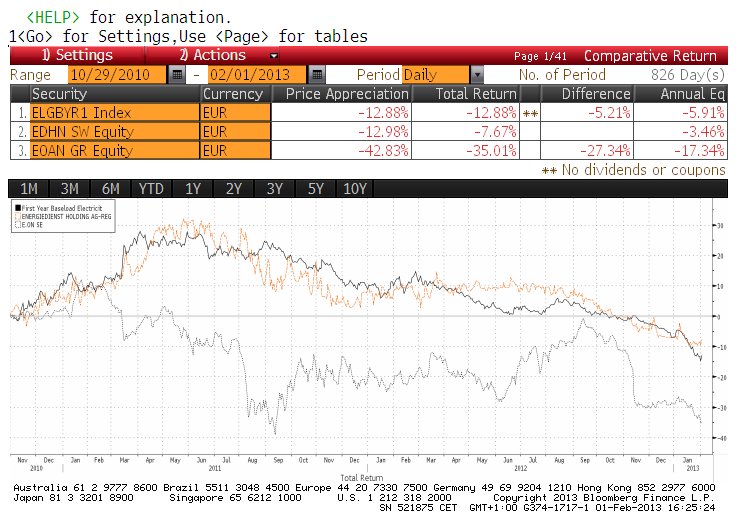
But in any case, a Hydro Power “pure play” is more or less a “bet” on electricity prices. In order to check this theory, I let’s look at EDHN’s share price (in EUR) against 1 year forward prices for German electricity (as a comparison, I plotted E.on as well):
I find it fascinating that over the past 2.5 years, Energiedienst more or less directly followed German power prices. We can see that E.on is much more volatile and most likely exposed to general stock market fluctuations.
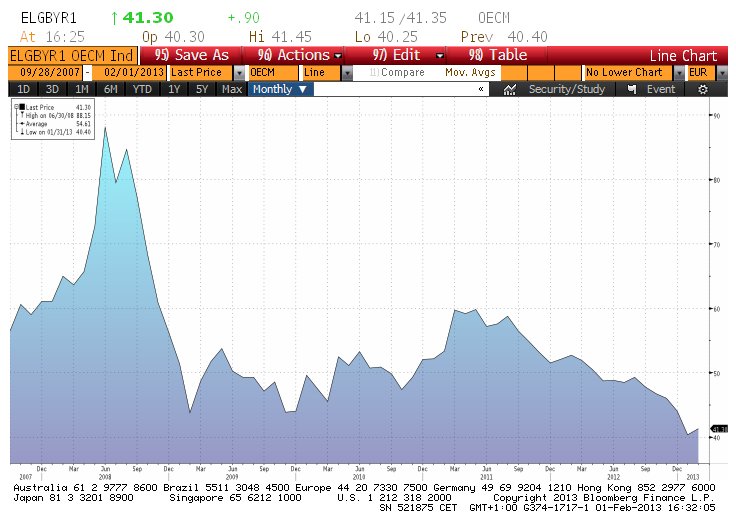
Just for the complete picture a history of German wholesale electricity prices since 2007:
It is interesting to see that German power prices seem to be at the lowest level since the beginning of this time series in 2007. After the surprise phase out of nuclear power after Fukushima and the corresponding propaganda from E.on & Co, one might have expected exploding electricity prices. But it looks like that the new supply of alternative energy plus maybe reduction in consumption led to a dramatic decrease in electricity prices.
Digging deeper, I found for instance this German publication from 2011 which confirms the point, that the subsidized renewable energy will lower electricity prices in general. So for a renewable hydro player like Energiedienst, the subsidies to solar and wind have the “perverse” effect of lowering the profit of this very cheap type of electricity significantly.
The “trick” is that the electricity distributors have to buy the renewable electricity at fixed subsidized prices, but have to sell it at current market prices into the German electricity exchanges. The difference then gets charged to consumers. According to the paper, the electricity price clears at the level of the most expensive supplier. The mechanism for the renewable providers however introduces practically a big source of potentially extremely cheap electricity as it gets sold at market prices no matter how low they might be and “unelastic” to the actual demand.
Due to the low interest rates, subsidized wind parks and solar plants are still attractive investments despite the price for electricity being at multi year lows and demand being rather weak.
So the low prices are not a result of low demand, but mostly of subsidized renewable energy which will be sold as long as the price is higher than zero.
Zero hedge just had a post in its usual style, claiming that the falling energy prices are a harbinger for falling stock prices. That is correct for utilities but other than that it is just a result of the mechanism described above.
Summary:
The current system for renewable energy in Germany (selling renewable electricity into the market at any price with the consumer paying the difference) is hell for “traditional” utilities including hydro power.
The German utilities have maybe underestimated the extent of renewable production, otherwise they could have done the exactly same thing themselves. Now howver, the are in a kind of “death grip” between having to run their expensive black coal and gas plants for peaks and the articificially low electricity prices. Combined with unfavourable natural gas delivery contracts, especially for E.on the air will remain quite thin.
So unless something changes significantly, German utilities (including Energiedienst) will need a long long time to adjust capacity and change their business models.
Warren Buffet seems to be much more clever: If you can’t beat them, join them. I think this is the reason why his US utility is investing so much into Solar and Wind.
To be honest, I don’t think that the current portfolio has an equal upside potential like in the beginning of last year, mostly due to the lack of really interesting special situation investments. For instance, the upside of athe Draeger Genußschein was much higher when it trades at~2.5 times the pref shares than the current 4.5 times.
Well, I was obviously very wrong on that one. The portfolio gained gained 8.6% in January, the largest single month gain in the 25 months of the portfolio’s history. The Draegerwerke Genußschein alone gained 25%, other top performers were Tonnelerie (+19%), KAS Bank (+17%) and Dart & Cranswick 15% despite the strong Euro.
The outperformance again the Benchmark (4.9% outperformance) can be almost fully explained by the typical January small cap effect which has been covered quite well by Mebane Faber. The German small cap index SDAX for example gained 10% in January.
Portfolio as of January 31st
Name
Weight
Perf. Incl. Div
Hornbach Baumarkt
4.3%
9.5%
AS Creation Tapeten
4.0%
29.0%
WMF VZ
3.5%
57.0%
Tonnellerie Frere Paris
5.4%
56.2%
Vetropack
4.4%
4.6%
Total Produce
5.8%
55.9%
Installux
2.9%
6.7%
Poujoulat
0.9%
6.4%
Dart Group
3.8%
100.7%
Cranswick
5.1%
12.9%
April SA
3.4%
39.0%
SOL Spa
2.4%
6.8%
Gronlandsbanken
1.1%
24.4%
KAS Bank NV
5.1%
27.5%
BUZZI UNICEM SPA-RSP
5.2%
18.9%
SIAS
6.1%
59.5%
Bouygues
2.7%
8.7%
Drägerwerk Genüsse D
10.6%
142.9%
IVG Wandler
4.5%
13.7%
DEPFA LT2 2015
2.8%
56.6%
HT1 Funding
4.6%
44.9%
EMAK SPA
4.2%
23.1%
Rhoen Klinikum
2.2%
3.0%
Short: Focus Media Group
-0.9%
-2.7%
Short: Prada
-1.0%
-10.8%
Short Lyxor Cac40
-1.2%
-8.5%
Short Ishares FTSE MIB
-2.2%
-13.7%
Terminverkauf CHF EUR
0.3%
7.4%
Tagesgeldkonto 2%
10.0%
Value
47.0%
Opportunity
48.1%
Short+ Hedges
-5.1%
Cash
10.0%
100.0%
The only change to year-end is Sol Spa which was bought in the beginning of January. Cash is now exactly at my target level of 10%. that means any addition will trigger automatically a sale of another position.
He mentions one of the cardinal sins in current markets:
I’m writing this, of course, to focus myself. One of the hardest things to do is…. to do nothing. The instinctive reaction to a rising market is to pile on, add shares, up your leverage. But really that’s the absolute worst thing you can do. Don’t kid yourself.
Clearly, jumping into the market because you missed out the rally, especially in risky “high beta” stocks will most likely end in tears.
However another potentially big mistake should also not be underestimated: Taking profits too early. Most investors (including myself) get nervous if their stocks climb quickly 20-30%. What you then often hear is something like “It never hurts taking a profit” or “No one ever got bankrupt by taking a profit” or something similar.
The truth is: In order to generate above average returns, taking profits too early hurts badly. Statistically, the vast majority of investment ideas will be rather average, some will be bad, but some of them and usually only a small amount will be really really succesful.
If I look at my portfolio, most the outperfomance of ~23% over the last 25 months can be attributed to only a few positions especially Draegerwerk, Aire KgAa, Dart Group which have all doubled.
In all cases, it was and is always tempting to sell out and “take the profit” quickly. For Draegerwerk and Aire, I started selling too early, however I was lucky to start only with small amounts. Looking back over my 25 year investment “carreer”, I made many mistakes. However the most costly ones in the end were selling companies like Fuchs, Rational or Fielmann much to early.
Fuchs AG Vz. for example was one of the stocks I bought during the 2008/2009 around 12 EUR (adjusted for the split) and happily took the profit end of 2009 at 20 EUR, feeling like an investment genius. However, with the stock now at 58 EUR (plus a few Euros dividends in between), it looks pretty stupid. I knew that Fuchs was an outstanding company. Even worse, if I would have kept those shares the gains would have been tax free as they would have not been subject to the “Abgeltungssteuer” introduced in January 2009.
So looking back, “taking the profit” on a share like Fuchs (much) too early was maybe one of the biggest and most expensive mistakes in my investment career.
If we simply look at very basic profitability numbers, we can see that the numbers look almost too good to be true:
ROE
NI margin
Net debt per share
31.12.2002
27.1%
2.8%
-1.46
31.12.2003
28.5%
3.1%
-2.28
31.12.2004
34.5%
4.0%
-4.74
30.12.2005
38.0%
4.6%
-5.92
29.12.2006
39.1%
4.8%
-7.33
31.12.2007
35.3%
4.8%
-4.09
31.12.2008
24.3%
3.8%
-4.44
31.12.2009
13.3%
2.9%
-5.15
31.12.2010
16.7%
3.6%
-6.98
30.12.2011
21.2%
3.9%
-10.39
avg
27.8%
3.8%
The 10 years from 2002-2011 is a full cycle with boom and bust years, so achieving on average an ROE of 28% with a financially unlevered balance sheet is outstanding.
How do they do it ? The answer is (of course) effective capital management. I have used Bloomberg data for this but if we look at the last 6 years we can see that their capital management is really outstanding:
FY 2011
FY 2010
FY 2009
FY 2008
FY 2007
FY 2006
Goodwill
45.34
40.75
36.6
37.11
33.64
17.31
PPE
17.8
16.39
13.96
14.39
12.02
9.59
Inventory
21.74
20.8
24.23
24.14
21.17
7.95
Receivables
82.11
74.41
57
80.9
91.2
82.5
Prepayed expense
27.06
25.37
23.36
24.85
23.24
44.49
Accounts payable
96.9
81.88
70.95
93.26
92.58
80.06
Net Working capital
34.01
38.7
33.64
36.63
43.03
54.88
Revenue
583.91
443.06
395.84
499.62
482.97
424.98
Net income
22.68
15.83
11.51
18.9
23.19
20.2
PPE in % of sales
3.0%
3.7%
3.5%
2.9%
2.5%
2.3%
Net Working capital in % of sales
5.8%
8.7%
8.5%
7.3%
8.9%
12.9%
PPE+Net WC in % of sales
8.9%
12.4%
12.0%
10.2%
11.4%
15.2%
Running a business with only ~9% of “operating” net assets compared to sales is something you don’t see very often.
Let’s have a quick look at Kaufman & Broad, another French listed home and appartment builder:
FY 2011
FY 2010
FY 2009
FY 2008
FY 2007
FY 2006
Goodwill + int
151.52
150.82
150.5
149.71
149.81
69.96
PPE
5.88
5.99
5.93
7.27
9.47
8.87
Inventory
235.56
246.15
295.74
519.52
595.46
513.2
Receivables
305.67
203.33
203.77
296.26
405.7
309.13
Prepayed expense
141.26
159.48
139.43
158.64
147.39
122.14
Accounts payable
409.67
377.29
398.79
552.65
620.98
535.91
Net Working capital
272.82
231.67
240.15
421.77
527.57
408.56
Revenue
1,044.26
935.70
934.91
1,165.11
1,382.57
1,282.83
Net income
0
0
0
0
0
0
PPE in % of sales
0.6%
0.6%
0.6%
0.6%
0.7%
0.7%
Net Working capital in % of sales
26.1%
24.8%
25.7%
36.2%
38.2%
31.8%
PPE+Net WC in % of sales
26.7%
25.4%
26.3%
36.8%
38.8%
32.5%
Interestingly, Kaufman & Broad improved their capital management as well but they still need 3 times the operating net assets to generate roughly the same returns.
This of course shows in Profitability:
ROE
NI margin
Net debt per share
31.12.2002
21.4%
4.4%
5.90
31.12.2003
20.8%
4.5%
2.55
31.12.2004
20.1%
4.7%
3.46
30.12.2005
28.7%
5.9%
3.79
29.12.2006
33.5%
6.6%
4.64
31.12.2007
31.8%
6.1%
16.74
31.12.2008
4.6%
0.7%
19.90
31.12.2009
-31.1%
-3.2%
12.46
31.12.2010
19.4%
1.9%
9.92
30.12.2011
37.7%
4.5%
7.69
avg
18.7%
3.6%
Despite a significant leverage, ROE are lower on average and due to the leverage much more volatile.
Maybe this is one of the reasons why Maisons has outperformed larger Kaufman by a wide margin over the last 10 years.
Just for fun, let’s also look at Helma AG, a small homebuilder in the currently booming German market:
FY 2011
FY 2010
FY 2009
FY 2008
FY 2007
Goodwill + int
2.21
2.19
1.85
1.63
1.51
PPE
16.31
14.57
14.89
15.48
13.79
Inventory
19.83
8.63
5.61
5.8
6.67
Receivables
10.59
6.33
4.27
3.47
2.92
Prepayed expense
8.85
5.76
3.11
2.98
2.72
Accounts payable
5.85
5.02
0.76
0.79
4.72
Net Working capital
33.42
15.7
12.23
11.46
7.59
Revenue
139.50
118.50
106.68
103.59
74.54
Net income
5.2
3.4
2.36
2.31
1.3
PPE in % of sales
11.7%
12.3%
14.0%
14.9%
18.5%
Net Working capital in % of sales
24.0%
13.2%
11.5%
11.1%
10.2%
PPE+Net WC in % of sales
35.6%
25.5%
25.4%
26.0%
28.7%
Interestingly, the operate roughly at the level at Kaufmann & Broad but nowhere near MFC’s level. Helma by the way actually seems to have jumped into property developement which might explain the increase in operating assets.
So compared to two other homebuilders, the business model of Maisons France looks extremely “lean” from a capital management point of view. The big question of course is why are they so much better ?
I think the big “trick” was already mentioned in the Ennismore summary from last week’s post:
Unlike many other markets, in France there is virtually no development risk for the company because land is purchased separately by the customer and the house will only be built once it is fully financed.
In their annual report, there is a hint how they operate:
Under Note 4.8 (receivables) we find the interesting information, that the receivables amount on their balance sheet is a net amount. So the roughly 80 mn receivables translate into 320 mn gross receivables against which they show something like 250 mn prepayments.
Those prepayments, which they seem able to get are basically an interest free float which explains in my opinion the superior ROE and ROIC metrics compared to the other builders.
Summary:
From a pure capital management perspective, Maisons France Confort seems to have a very good business model. they seem to generate a lot of interest rate free “float” which greatly reduces the required amount of net operating assets.
I am not sure if currently is the right time to invest as the stock has run up quite fast and french housing might be slow this year, but is definitely a very interesting company.
The big quesiton is: Is such a business sustainable without an obvious “moat” ? In my opinon yes, because creating such a business model is not something you can do from scratch. 3-5% margins are not overly attractive for many competitors. Howevr, in any case some deeper research into to this will be necessary anyway before a final investment.
The weekend is always a good time to step away from the “micro level” i.e. single stocks to more general considerations.
More recently, if find myself more and more analysing French stockss, as they seem to be technically still quite cheap. In my portfolio, the weight of my French stocks Bouygues, Tonnelerie, Installux, April, Poujoulat is around 15% and growing.
On the other hand if you read especially “Anglo Saxon” media, it seems to be clear that France is in deep trouble.
The economist article greatly summarizes the overall view on the German economy of that time:
But it is now coming under pressure as never before. As economic growth stalls yet again, the country is being branded the sick man (or even the Japan) of Europe.
The reason was clear: A socialist Government and suspicious company bosses:
The red-green coalition government led by Gerhard Schröder since last October has “encouraged the suspicions of a corporate sector predisposed to fear the worst,” says Alison Cottrell, chief international economist at PaineWebber in London. The dark picture painted by Hans Eichel, Mr Lafontaine’s replacement, to justify fiscal belt-tightening has further unsettled industrial bosses. And a lack of corporate confidence has been one of the main factors that has kept unemployment so high.
The 1999 article mentions all the “standard” prerequisites for a better future like lowering corporate taxes, increasing flexibility but finishes with a quite bleak outlook:
It is, perhaps, not surprising that market-friendly politicians, including one or two in the government, now complain of Germany being a blockierte Gesellschaft (blocked society). Unblocking it will take determination. Without that, Germany is unlikely soon to shed its title as the sick man of Europe.
So what happened in between, how did the sick man of Europe become the (temporary) growth engine ?
Let’s look at Corporate taxes for instance:
It is interesting to see that the biggest drop in corporate tax rates actually happened in the 1998-2005 period where Gerhard Schroeder led a Social Democratic/Green government.
In my personal opinion, a combination of several factors has at least contributed to the change in fortune of Germany at least so far:
– lower tax rates on corporation which stimulated investment in Germany
– Hartz IV which “motivated” people to go back to work quicker when they lost a job
– increased labour flexibility (“Kurzarbeit”, etc.
– a generally cooperative climate between trade unions and employers with modest salary increases and more one time awards
– privatisation of major Government companies such as Deutsche Post, Deutsche Telekom etc.
A second set of developments which in my opinion is not so prominent but were nevertheless equally important:
The end of the “Deutschland AG” which was the description for the fact that almost all German companies were owned locally and/or by each other. Management of German companies did not have a lot of pressure because each manager sat on the board of several other companies. In the center of The Deutschland AG were the big financial institutions such as Deutsch Bank, Muenchener Rück, Commerzbank and Allianz.
The end of the “Deutschland AG” was driven in my opinion by 3 major developments:
– the removal of taxes on investment gains for corporations in 2002
– the problems of the large German financial institutions after the 2002/2003 crash which forced them to sell their shareholdings
– finally the Euro. Before the Euro, German Insurers for instance had to invest 95% of their investments in Deutschmark. So basically if they had to invest in German shares because there was no alternative. After that, the 5% restriction changed to “non Euro”, so suddenly german insurers could diversify their portfolios into the Eurozone.
Although there will always be a special relationship between companies in one country, one can say that the old “Deutschland AG” does not exist any more. One of the big examples for instance was the take over of Hochtief, the German construction company by ACS from Spain. 15 years ago, something like this would never had happened. Deutsch Bank or someone else would have organized a defense.
From the German example we know now that a title story in the economist might not be the best indicator for the future of a country. In the cae of France is see a few similarities to Germany in the end of the 90ties:
Without being an expert in French politics, however from my outside view this looks like a brilliant political move from Hollande. He gives his leftwing voters something directly and spectacular to calm them down. I would assume that a guy like Bernard arnault is not paying that much taxes in France anyway, so it doesn’t really hurt seeing him leaving.
But as history shows, at least in continental Europe, real labour reforms are mostly implemented by Socialist Governments, liberal or conservative ones. As always, the comment says that this is not enough:
Still, this is no Reagan (or even Schröder) Revolution. The unions will preserve counterproductive worker protections and welfare guarantees. The deal includes expanded privileges for union reps within companies and more reserved seats on company boards.
However, you have to start somewhere and together with his “U turn” in corporate taxation, this is a significant green shoot in my humble opinion.
Last but not least I see two other interesting factors at work which might point to a better future for France:
From a demographic standpoint, France and Germany are thus in radically different situations. While France has maintained a satisfactory fertility rate, almost sufficient to ensure the long-term stability of the population, Germany’s low birth rate will lead to a substantial and rapid decline in the total population and to much more pronounced ageing than in France (Figures 3 and 4).
At some not so very distant point in the future, there will be more Frenchies than Germans:
So yes, France has definitely a problem with youth unemployment, but part of the problem is that they actually do have a lot of young people which Germany does not have any more.
Africa
I am not able to comment on Mali or any other political issue here. But if at some point in time Africa will catch up with the rest of the world, French companies will benefit most due to their historical relationship etc.
Summary:
It is clear that France at the moment does not look like the future growth machine of Europe but neither was germany end of the 90ties. However I see a good chance that France finally gets it act together and implements the required reforms. If that happens, France could experience a somehow similar trajectory like germany over the last 10-15 years.
From an investment point of view, this might be one of the most interesting “secular” opportunities going forward despite (or because of) the very negative headline news. From a micro level, I find a lot more well managed, unlevered companies in France than in all the PIIGS countires combined.
From a portfolio point of view, I will accept a quite significant weighting of French stocks if I find additional interesting french companies. I could imagine having up to 30-50% of french stocks in my portfolio going forward.
But make no mistake, this will be a long journey and superior investment returns on French stocks might require more then 1 or 2 years to materialise.
And finally to make this a little bit funnier, the Monty Python take on the epic battle between the English and the French: