Category Archives: Uncategorized

Book review: Dark Genius of Wallstreet

Easter time is a good time for a “historical” book review:

The book is about the life of Jay Gould, one of the most notorious “Robber barrons” in the 19th Century in the US.

The so called “robber barons” were a group of several “arch capitalists” who made their money in the 19th century through means which nowerdays would be punished with prison.

However in those days, there was no such things as “insider training”, people were even considered stupid if they traded stocks without insider information.

The first part of the book covers Jay Gould’s childhood which I found personally a little bit boring. It gets more interesting around page 50 or so when Jay Gould’s first real business venture, leather manufacturing is described where he starts as a junior partner.

It is fascinating to see how quickly he realizes that the production part of the value chain is the most capital consuming and risky part wheras the traders need a lot less capital and make more or less the same amount of profit. Naturally he started to speculate early in leather futures.

The “spirit” of those times is already clearly shown in the fight over a leather production site with the heirs of his former partners. “Unfriendly takeovers” in those times were a lot more unfriendly than today, not only involving lawyers but also armed men and gun fights.

Some how naturally he finds his way to Wall Street, where he starts as a so called “curb trader”, traders who literally stood outside the stock exchange and making bets because they had no license to trade directly.

After trading a lot, Gould started pretty early to actually taking over a small railroad company a and operate it on a day today basis. To day one would call this a public-to-private equit deal. This lead directly to the famous battle for Erie Railroad between Gould, Vanderbild, Drew and Fisk one of the most intensively fought battles in corporate history. Anfd fighting again in those times meant armed men etc etc

More or less in parallel, Jay Gould tried with James Fisk tried to corner the Gold market, resulting in the “Black friday” of 1869.

At the peak of his career, he even managed to control Western Union additionally to a combination of several important railroad lines.

Summary:

I think it is a great read for everyone interested in the history of capital markets. The book also shows that nothing is really new in capital markets, neither market volatility nor crashes etc. It is also interesting to gain some insight into those “dark ages” of insider based capital markets, maybe a good training if someone wants to invest in China or India…..

Weekly links

Great book review of “Investing in Japan” from Nate at Oddball

Interesting paper why a “long low beta, short high beta” portfolio outperforms

Interesting Q&A session with David Einhorn

Groupon: Less than 6 months after the IPO, Groupon has to restate earnings and the auditor has identified “material weaknesses”. Short candidate.

Sino forrest is finally bankrupt but sues Muddy Waters for 4 bn USD….

Edit: Although it is not a listed stock, this article about Goretex contains a lot about how to create and defend “moats”…

Banca Civica – Take over Spanish style

A couple of months ago I looked at Spanish “Thrift conversions”, especially Banca Civica which was a potential take over candidate.

Now, the take over was finally announced by Barcelona based Caixabank, however with a significant discount to the prevailling market price:

The share valuation for Civica in the transaction is 27 percent lower than the 2.70 euro-per-share price of its initial public offering in July, in which it raised 600 million euros. CaixaBank has a market value of 12.1 billion euros

The offered 1.97 EUR is a 11% discount to the previous day closing price and equally an all time low for the Banca Civica stock since its IPO.

So this is something to keep in one’s mind: You can basically do takeovers/tender offers in Spain well below current market prices.

Record Profit Margins – follow up German companies

Following up on Tim’s comment, I had a quick look at German HDAX companies. Unfortunately, only a subset of 2011 figures are currrently available.

What I did was the following: For those companeis where 2011 net margins were available, I calculated the 10 year average net margin. I then subtracted this from the 2011 margins to see if 2011 was better or worse than the average.

name avg 10 Y margin 2011 NI margin Current vs. average
FUCHS PETROLUB AG -PFD 6.0% -0.3% -6.3%
PUMA SE 10.6% 7.6% -3.0%
BEIERSDORF AG 7.3% 4.4% -2.9%
MUENCHENER RUECKVER AG-REG 3.9% 1.2% -2.8%
SALZGITTER AG 4.7% 2.4% -2.3%
KRONES AG 3.2% 1.8% -1.5%
RWE AG 5.1% 3.6% -1.4%
HEIDELBERGCEMENT AG 4.5% 3.2% -1.3%
QIAGEN N.V. 15.4% 14.2% -1.2%
HOCHTIEF AG 0.5% -0.7% -1.2%
DEUTSCHE LUFTHANSA-REG 2.1% 0.9% -1.2%
ADIDAS AG 4.8% 5.0% 0.2%
HENKEL AG & CO KGAA VORZUG 7.6% 8.0% 0.4%
AURUBIS AG 2.1% 2.6% 0.5%
BECHTLE AG 2.6% 3.1% 0.5%
BILFINGER BERGER SE 1.9% 2.7% 0.8%
DEUTSCHE TELEKOM AG-REG -1.9% -1.0% 0.8%
COMMERZBANK AG -0.5% 0.7% 1.1%
GILDEMEISTER AG 1.3% 2.7% 1.4%
CONTINENTAL AG 2.3% 4.1% 1.8%
CARL ZEISS MEDITEC AG – BR 6.7% 8.9% 2.1%
BAYER AG-REG 4.5% 6.8% 2.3%
SGL CARBON SE 2.5% 4.8% 2.3%
LEONI AG 1.8% 4.2% 2.4%
SOFTWARE AG 13.6% 16.2% 2.6%
BAYERISCHE MOTOREN WERKE AG 4.4% 7.1% 2.7%
FRAPORT AG 7.5% 10.1% 2.7%
DAIMLER AG-REGISTERED SHARES 2.5% 5.3% 2.8%
BASF SE 5.5% 8.4% 2.9%
DUERR AG -0.5% 3.2% 3.7%
SIEMENS AG-REG 4.5% 8.6% 4.1%
ADVA AG OPTICAL NETWORKING 1.3% 5.5% 4.2%
PSI AG -0.2% 4.3% 4.5%
DEUTZ AG -0.1% 4.5% 4.6%
HUGO BOSS-PFD 8.9% 13.8% 4.9%
K+S AG-REG 6.9% 12.8% 5.9%
VOLKSWAGEN AG-PFD 3.2% 9.7% 6.4%
SAP AG 16.7% 24.1% 7.5%
DRILLISCH AG 2.0% 12.0% 10.0%
AIXTRON SE 3.1% 13.2% 10.1%
MORPHOSYS AG -7.6% 7.9% 15.5%
DIALOG SEMICONDUCTOR PLC -6.1% 10.7% 16.8%

So from the 42 companies with relevant data, only 11 are below average, whereas 31 are above the 10 year average net income margin in 2011.

On average, 2011 profit Margins were 6.4% of sales for those companies against 3.9% for the last 10 years. If we would assume constant P/Es, than a return to “normal” would mean a drop in earnings on average by -39% or implcitly an over-valuation of those companies of 39% (keeping everything else constant).

I will try to update as sson as more results are published, but if one believes in reversion to the mean, some of those comapneis should be avoided.

James Montier on record profit margins

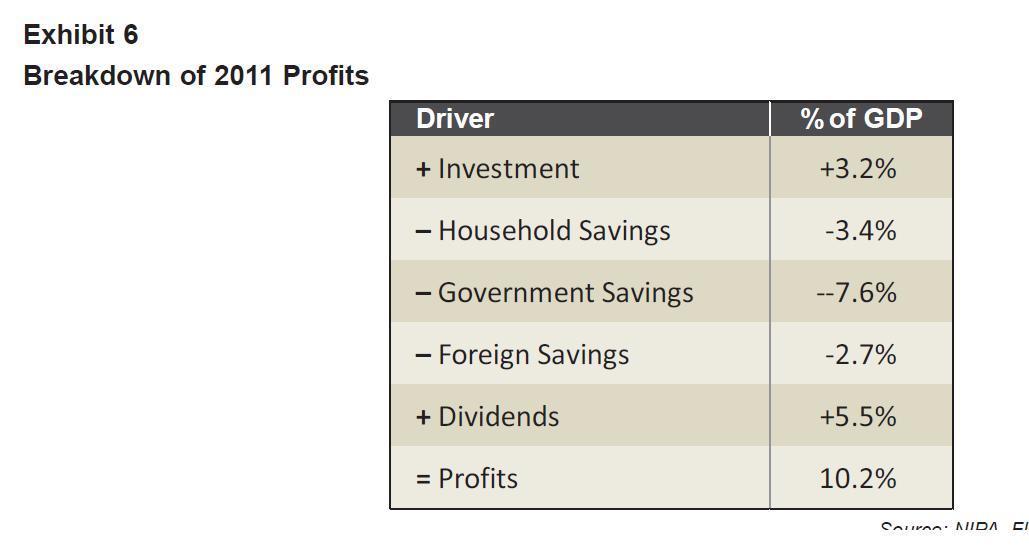
James Montier has issued a very interesting reasearch piece on why profit margins are so high.

This is something which is also bugging me all the time. The Chart on page 2 is especially interesting:

He then continues deriving the sources of profit margins and comes to an interesting conclusion: That the increase in Government spending is the major source of current margins !!!

This is quite interesting. In practice, I think his theory has some minor issues, for instance he implies that US corporate profits are only produced within the US, which for many big companies (Apple, McDonalds) is clearly an oversimplification.

If I look at companies like Volkswagen for instance, a lot of the high margins come from the booming BRIC countries, however also those times will end.

I also find it intersting to think about how his theory works in practice. If one looks at Apple for example, one could clearly see that one part of the high margins are also low production costs in Asia which means lost jobs and higher unemployment (and lower wages) in the US.

However, as the unemployed (and other US citizens) get direct and indirect paymants from the government, in theory this enables them to buy Iphones without having a job. So indirectly the US Government pays for Iphones.

Another point which is missing in Montier’s model are the current low interst rates. Based on average debt ratios, this might add a point or two in corporate profit margins as well.

As always, one has to be careful not to fall into the “confirmation bias” trap, but I find it highly likely that current record profit margins are driven by a unique combination of high Government spending, low interest rates and booming BRIC countries which most likely will not last.

Apple and the value of paying a dividend

Yesterday, the most important news was the fact that Apple announced to start paying a dividend and additionallyto buy back shares in an amount of up to 10 bn USD.

Contrary to many news stories, the announced dividend plus the share repurchase program will not lower the 100 bn USD cash pile as the free cash flow of Apple is currently way above the amounts they plan to distribute.

Nevertheless the Apple shares gained above the market gains yesterday, so the news was received positive by investors (good collection of stories here at Abormal Returns)

Let’s have a quick look at the theory of how to value such annoncements in general.

Efficient market

In a truly efficient market, a decision to distribute a dividend would not matter at all. Every investor would value the company purely based on free cashflows at company level, adjust correctly for any retained cash on the balance sheet and being indifferent if the money is distributed or not.

Potential positive impacts:

In many articles about the Apple price move, commentators mentioned the following reasons why paying (or increasing) a dividend should be positive for shareholders

a) Management shows more confidence in future cash flow generation
b) Management has less money to spend on (stupid) acquisitions, especially for former high growth companies (see e.g. HP)
c) Investors have a preference for current income
d) Unadjusted P/Es go down for cash rich companies, which then leads to a further increase in stock prices

Negative impacts

e) Dividends get taxed at the level of the shareholder
f) management has run out of growth options, paying a dividend signals “peak growth”

In the conference call, Tim Cook started the call with emphasizing the potential growth opportunities of Apple, clearly targeting point f) in the list above.

Personally, I think with especially with Apple c) and d) does not apply either. No one is buying Apple now because of the dividend and everyone knows the amount of the cash pile. I think argument b) could have some merit, especially when you look at HP when Leo Apotheker took over and directly overspent on an acquisition.

However, as I do not own Apple and don’t want to buy or short it for the time being either, I wanted to focus on some general aspects of dividend payouts.

Well managed companies (Compounders, steady growers)

For a well managed company with significant growth opportunities which is managed on a long term basis, I couldn’t care less about dividend payouts. Soo in my opnion, for really well managed companies with growth potential, the “efficient market” thesis holds

Indebted companies

Companies, which are for some reasons relatively heavily indebted but have a solid business model, should in most cases not start to pay dividends before they have significantly reduced their debt burden. Paying back debt and reducing cost of capital can be in many cases much more value enhancing than starting to pay dividends too early. So in suchh cases, an increase in dividend could be a bad sign.

Badly managed but cheap companies

Here the case is clear: As long as the cash stays on the balance sheet of a badly managed company, there is always the risk that the cash could dissapear any time, either through stupid acquisitions, over-investment or even fraud (Chinese RTOs anyone ?). In such cases, the announcement to pay significant dividends out of retained cash would definitely be value enhancing by reducing implicit risk.

Declining companies

The best documented example of a declining company is WB’s very own Berkshire Hathaway. This was the classic case of a company which would have kept investing in its declining business until they would have been bankrupt. In such cases, the commitment of paying out or maintaining large dividends instead of reinvesting is definitely a plus.

Announcement of Dividends vs. buy backs

In my very simple view, the announcement of a dividend and a stock buy back are very different. Whereas for the dividends, any non-payment would be highly difficult, buy backs often get announced but only partially executed. Additionally, a buy back is always a one time item whereas a dividend implcitly assumes a certain continuity in payments. So I would put much more weight on dividend announcements than stock buy back announcements.

In some case, one will really have to look deeply into companies to judge if a dividend announcement is positive or not. For instance if a higly indebted shrinking company increases its divdends, is this good or bad ? Or if a highly indebted company shrinking stops paying dividends to pay off debt, what is the net result of this ?

Nevertheless I want to summarize the impact of dividend and stock buy back announcements as follows:

Announcements of increased dividends and/or stock buy backys are most value enhancing for

+ badly managed companies with high a cash pile
+ shrinking companies with high free cash flows and a relatively low debt burden

For well managed and growing company, such announcements should not impact the value significantly.

Especially if analyzing “cheap” and “contrarian” companies, one could use the payout ratio also as an indicator for the required return on capital. A higher payout ratio should lead to a lower required ROC and vice versa.

Exotic securities: “Detachable GDP linked Greek warrant” – Valuation approach

In the first post i quickly looked at the features of the “Detachable GDP linked Greek warrant” (ISIN GRR000000010)

With securities like this, there are usually many ways to try to value this. You could eiher lock up a handfull of rocket scientists into an office and only let them out if they produce a model which is mind boggingly difficult, including at least features like “Monte Carlo simulation, path dependend barrier option etc.” or you can try a “common sense” approach to get a feeling about the risks and value drivers of such a complex structure. As anon-rocket scientist, I prefer the second one.

In order to get a rough idea how to evaluate this, we have to make sure to understand the following issues and risk factors:

Default risk

If Greece defaults, we don’t have to worry about GDP growth anymore. We should assume zero value (no recovery) in this scenario.

Maximum pay out

As discussed, the bond pays out a maximum of 1% on outstanding notional starting 2015. Based on the amortisation schedule (by the way: here is the Reg_S_Invitation_Memorandum1 GDP warrant starts at page 52) we can compute the best case cashflows:

Nominal Coupon max Payment in % of original amount
2012 100.0%    
2013 100.0%    
2014 100.0%    
2015 100.0% 1% 1.00%
2016 100.0% 1% 1.00%
2017 100.0% 1% 1.00%
2018 100.0% 1% 1.00%
2019 100.0% 1% 1.00%
2020 100.0% 1% 1.00%
2021 100.0% 1% 1.00%
2022 100.0% 1% 1.00%
2023 100.0% 1% 1.00%
2024 95.2% 1% 0.95%
2025 90.5% 1% 0.90%
2026 85.7% 1% 0.86%
2027 81.0% 1% 0.81%
2028 76.2% 1% 0.76%
2029 71.1% 1% 0.71%
2030 66.0% 1% 0.66%
2031 61.0% 1% 0.61%
2032 55.9% 1% 0.56%
2033 50.8% 1% 0.51%
2034 45.7% 1% 0.46%
2035 40.6% 1% 0.41%
2036 35.6% 1% 0.36%
2037 30.5% 1% 0.30%
2038 25.4% 1% 0.25%
2039 20.3% 1% 0.20%
2040 15.2% 1% 0.15%
2041 10.2% 1% 0.10%
2042 5.1% 1% 0.05%
2043 0.0% 1% 0.00%
       
Total     18.62%

So in the “perfect recovery case” and ignoring the option of the Government, the bond will pay out a maximum total of 18,62% of nominal value over its life.

Bond equivalent

If we then forget for a moment about the GDP triggers, we could calculate a market value for a bond with a fixed payement schedule resembling the best case of the GDP linker. For this we can use the current traded yield of the new greek Bonds, which is around 16% p.a.

Nominal Coupon max Payment in % of original amount NPV at 16%
2012 100.0%      
2013 100.0%      
2014 100.0%      
2015 100.0% 1% 1.00% 0.6%
2016 100.0% 1% 1.00% 0.6%
2017 100.0% 1% 1.00% 0.5%
2018 100.0% 1% 1.00% 0.4%
2019 100.0% 1% 1.00% 0.4%
2020 100.0% 1% 1.00% 0.3%
2021 100.0% 1% 1.00% 0.3%
2022 100.0% 1% 1.00% 0.2%
2023 100.0% 1% 1.00% 0.2%
2024 95.2% 1% 0.95% 0.2%
2025 90.5% 1% 0.90% 0.1%
2026 85.7% 1% 0.86% 0.1%
2027 81.0% 1% 0.81% 0.1%
2028 76.2% 1% 0.76% 0.1%
2029 71.1% 1% 0.71% 0.1%
2030 66.0% 1% 0.66% 0.0%
2031 61.0% 1% 0.61% 0.0%
2032 55.9% 1% 0.56% 0.0%
2033 50.8% 1% 0.51% 0.0%
2034 45.7% 1% 0.46% 0.0%
2035 40.6% 1% 0.41% 0.0%
2036 35.6% 1% 0.36% 0.0%
2037 30.5% 1% 0.30% 0.0%
2038 25.4% 1% 0.25% 0.0%
2039 20.3% 1% 0.20% 0.0%
2040 15.2% 1% 0.15% 0.0%
2041 10.2% 1% 0.10% 0.0%
2042 5.1% 1% 0.05% 0.0%
2043 0.0% 1% 0.00% 0.0%
         
Total     18.62% 4.23%

This table shows us, that the value of such a bond would be currently 4.23% based on the yields of the traded Greek Goevernment bonds

So let’s summarize this:

If the GDP linker would be a bond with a fixed payout amounting to the maximum payout of the discussed mechanism, its current value would be 4.23% of nominal value.

Next step: Assuming a “binary” option

Now just for fun, we could assume that the bond would only contain one option: If the first threshold is reached (2014 GDP 210 bn EUR, real 2014 yoy GDP growth of >= 2.34%) we could approx. work out the implied probabilityin current market prices.

So very simplistic (and mathematically not correct), with a curent price of the GDP warrant of ~0.80 % of nominal, the implied probability would be 0.80 EUR / 4.23 = 18.93% of achieving the required GDP scenario

Next step: More options !!!!!

As each years coupon payment of the bond depends independently on each years YoY real GDP growth, in theory each coupon would have to be valued as a seperate option. So theoretically, ignoring the nominal GDP hurdle, we have 29 single options packed into this security !!!

However, as we have seen in the second table, the options in the later year are worth almost nothing due to the high discount rate.

They payout itself is defined as the difference of the actual yoy GDP growth rate times 1.5 minus a reference GDP growth rate.

The reference rates are the following rates,the second colum shows the required rates for max.payout:

ref GDP yoy required for max
201400.00% 2.35% 2.23%
201500.00% 2.90% 2.60%
201600.00% 2.85% 2.56%
201700.00% 2.77% 2.51%
201800.00% 2.60% 2.40%
201900.00% 2.50% 2.33%
202000.00% 2.25% 2.16%
202100.00% 2.00% 2.00%

If we look at the Eurostat page, which publishes the relevant rate we can see that from 1996 until 2007, Greece had growth rates usually north of 3.5% with few exceptions. Interestingly they offer projections for 2012 and 2013 as well.

GDP hurdle: more fun

Maybe late at night during those negotiations an advisor thought: “hmm 29 different options with a non traded underlying is not difficult enough, so lets add some funky stuff !!!”.

As I described in the first post, no matter what the actual yoy growth rate looks like, the security only pays if certain nominal GDP thresholds are reached.

The thresholds are as follows:

year nominal GDP yoy
2014 210.1  
2015 217.9 3.71%
2016 226.4 3.90%
2017 235.7 4.11%
2018 245.5 4.16%
2019 255.9 4.24%
2020 266.47 4.13%
therafter 266.47 0.00%

To compare this with current data, I downloaded the GDP numbers directly from the official Greek statistical service, ELSTAT.

YEAR 2001 2002 2003 2004 2005 2006* 2007* 2008* 2009* 2010* 2011*
gdp 142 151 166 180 189 204 215 222 225 223 212

Interestingly, all numbers since 2006 are “provisional” whatever that means.

So in order to hit the nominal trigger, Greek GDP hast to reach 2011 levels in 2014.

Purchase Option

According to the prospectus, Greece has the “option” to purchase the warrants back. Howver this “option” isnot based on a fixed strike price but atrailing 30 day market price. Theoretically, an option at market price does not have any theoretical option value. However it introduces some “moral hazard” into the scheme. Greece could give a very bad outlook and then buy the Warrants back cheaply beforethen revising the outlook upwards.

So before this gets boring, let’s apply some common sense instead indulging in further quant dreams. In my opion one could think about the two main features as two “bets”:

A) Nominal GDP “bet”

This is basically a bet that Greece doesn’t fall in a deflationary trap and regains Nominal GDP around 2014.

B) Back to historical growth “bet”

This is the second bet that Greece goes back to historical growth and we get the full payout

In order to win this “game” one has to win both bets, winning only one is not enough.

If we further assume that the possibility of a Greek bankruptcy is independently reflected in our calculated discounted cash flows, we can value the security in the following way:

Probability of “Nominal GDP bet” times probability of “Historical growth bet” times NPV of max payout

With this assumption one can calculate a very simple valuation grid based on the NPV of 4.23% for the maximum payout:

Nominal bet        
Back to Growth 10% 20% 30% 40% 50%
10% 0.04% 0.08% 0.13% 0.17% 0.21%
20% 0.08% 0.17% 0.25% 0.34% 0.42%
30% 0.13% 0.25% 0.38% 0.51% 0.63%
40% 0.17% 0.34% 0.51% 0.68% 0.85%
50% 0.21% 0.42% 0.63% 0.85% 1.06%

So the picture is relatively clear: Only if one asumes for both, the non-deflation scenario and the return to historical growth bets a chance of 40-50% EACH, then the current market prices of around 80 cents might makes sense.

Personally, I don’t see the returns to historical growth rates any time soon, although I might accept a chance of maybe 50% that they can reach the nominal target.

At the moment, I would not buy this at any price. I think this is one of the securities which will “sleep” for a long time eventually die or maybe become interesting in 5 years when everyone has forgotten about them and Greece for some reason avoided bankruptcy again and one can get this for virtually nothing.

Edit:Some changes made with regard to the GDP growth formula and the repurchase option.Thanks to Dante for reminding me.

Exotic securities: “Detachable GDP linked Greek warant” (ISIN GRR000000010)

Yiiihaaa, this Monday was the first day this “beauty” is trading. As mentioned before, this is a security which is part of the “PSI package”.

As one could expect, this security is mind boggingly complex. As far as I understand, the features are as follows:

1. The max payout is 1% per year based on the nominal value
2. the first potential payment date will be 15th October 2015
4. The nominal Value will amortise after year 2022 to zero in year 2043
3. In order to trigger the payout, two principle conditions have to apply (apart from Greece not being not bankrupt)
a) the greek GDP has to be abvove a certain specified nominal amount
b) the growth rate of the real Greek GDP has to be aboev a certain specified rate
4. The Greek Government can “call” the warrants anytime from 2020 on based on a 30 day trailing market price

The specified nominal GDP hurdle for 2014 is 210 billion and increases to 260 bn EUR in 2020. Through Google I found an estimated GDP number for 2011 of 310 bn USD or ~ 238 mn EUr for 2011, so they could shrink further to a certain extent and still be above the trigger. Currently, GDP shrinks at -5.5 nominal rate. Two years with this rate would bring as very close to the trigger level.

The required real growth rates are in the area of ~2.35 to 2.8% in the first few years and then 2% thereafter.

I haven’t built a model yet, but from a theoretical point of view it will be a really fun exercise.

Market prices:

On monday the first trades on the German Exchange were ~1.25 % of nominal value, at the moment small lots are traded at 0.95 EUR. The lowest trades were executed at 0.85 EUR. The broker quotes I see are something like 0.75/1.00 so the banks don’t seem to be keen to make a market.

So let’s wait and see how this develoipes. In any case I always find it big fun to look at such “exotics”….

« Older Entries Recent Entries »