DISCLAIMER: The securities discussed in this post are very risky and the author might have already bought some before publishing the post. The overall situation is tricky and not really recommended for “normal” investors due to the involvement of some well known capital market “sharks”.
Celesio, the German pharmaceutical wholesaler has received a takeover offer a few days ago from US giant McKEsson at 23 EUR per share under the condition that at least 75% of shareholders will tender their shares
A few facts/background:
– majority owner Haniel (also largest shareholder of Metro) needs money and committed to tender their controlling block of 50.01% for around 2 bn
– in the meantime however Elliott, the US Hedgefund acquired more than 25% and threatened yesterday to block the deal
– under German law, 75% is the threshold to establish a profit & Loss transfer agreement which gives full control to the acquirer as well as tax benefits
As a result, the share price of Celesio dipped slightly below 23 EUR after hitting 23.70 EUR earlier.

The offer
McKesson has actually created a dedicated website for the offers with all documents, some videos etc here including the detailed offer document.
The acceptance period runs until early January with a potential extension period until end of January. Similar to Vodafone/Kabel Deutschland, talks about the take over become public already several weeks before the official offer. I think this is clearly part of the game from the seller in order to get a good price.
Nevertheless I found it surprising that since the first announcements of the deal, McKesson’s share price surged and dropped when Elliott said that they want more. Elliott is even using this as their main argument according to this article:
The surge in McKesson’s value by $7.7 billion since early October, when reports on a takeover offer appeared, was a clear sign the Celesio acquisition offers high synergies for the U.S. group and is a bad deal for minority shareholders, Elliott said.
Celesio looks clearly expensive at 23 EUR. However even without operational synergies there is a lot of potential for improvement. Celesio pays ~150 mn interest on 2bn loans, a 7.5% interest charge. McKesson is able to refinance below 2%, this alone is more than 100 mn p.a. savings.
Elliott Management
Elliott Management is a well known US hedgefund ran by Paul Singer. They are most famous for their over a decade long fight with the Argentinian Government, where some months ago, the even went so far to seize the sailing ship of the Argentinian Naval forces.

In Germany, they were already active in two similar Deals, Demag Cranes and Kabel Deutschland. At Demag Cranes, they already cashed out with a nice profit (~+30%), after blocking the threshold at 90% which allows a complete squeeze out. At Kabel Deutschland, the hold 11%, again blocking the squeeze out which works only if the acquirer has more than 90%.
With Celesio they seem to slightly change the tactic by acquiring 25% and actually threatening to block the entire bid. However, one aspect remains the same: They involve themselves only when Anglo-Saxon bidders are in the game. I guess they don’t want to involve themselves with potential unpredictable players in “Local feuds” like in the Rhoen case.
Anyway, one thing is clear: Elliott is clearly not a player which gets pushed around easily. On the other hand, they are in to make money. This is the main difference to the Rhoen case, where some of the players (B. Braun) wanted to block the deal at any cost.
Simple “Valuation exercise”:
I would assume that the “undisturbed” Celesio share price in the months before the offer was around 17 EUR. So if the deal falls through, at the current price one would experience a loss of -25%.
If we assume that there will be no “top up”, than we can easily calculate the implied current probability that the deal will not happen based on a simple “binary” model:
x = (current price-offer price) / (undisturbed price – current price) = (22.80-23)/(17-22.80) ~ 3.4%
Now if we want to speculate on a top up, we have to make two assumptions: How likely is a top up and how large will it be ? In order to keep it simple, I would assume a 50/50 chance for a top up and as I like “round” numbers, I assume 5 EUR per share or a final offer at 28.
This leads us to the following expected value under those assumptions:
Exp. value Celsio share = (3.4% x 17) + (48.3% *23) + (48.3%*28)= 24.25 EUR or around 10.6% higher than the current share price.
Not a monster undervaluation but still a very attractive “bet” as the time horizon is rather short until the end of January.
A Twist: The Convertibles
Up until recently, Celesio had to struggle to refinance their debts. So they had to offer two convertibles in the past, each with an amount of 350 mn EUR which convert each into 17 mn extra shares (current total shares out: 170 mn).
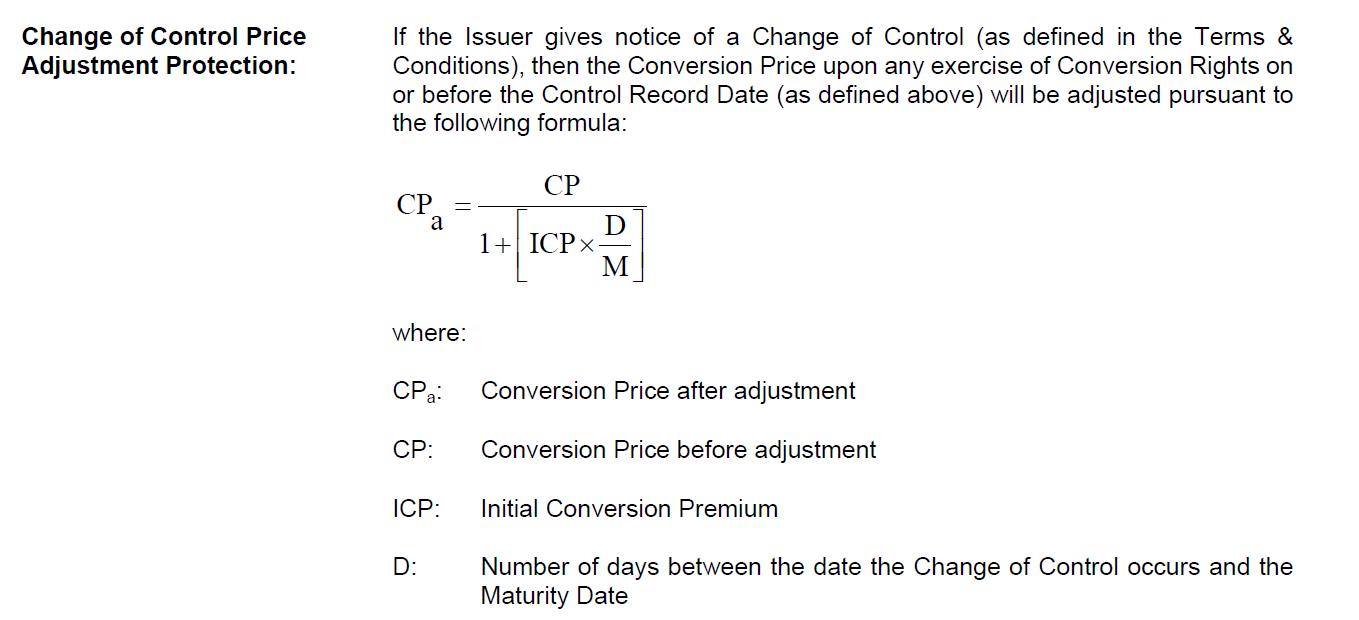
The 2014 convertible will mature in 2014 nd is not a big issue with regard to the take over. However, the 2018 convertible is in my opinion much more interesting. First of all, the official strike price of 22.49 EUR will be adjusted down in case of a take over to compensate bondholders for the conversion premium paid at issuance.
Unfortunateley, I could not locate the full prospectus, only the 4 page summary from Celesio’s homepage. One 100 k EUR bond allows the holder to convert into 4.448 Celesio shares at the initial conversion price of 22.49 EUR per share.
But now it gets interesting: In the case of a “change of control” event, the conversion price is adjusted downwards based on the following formula:
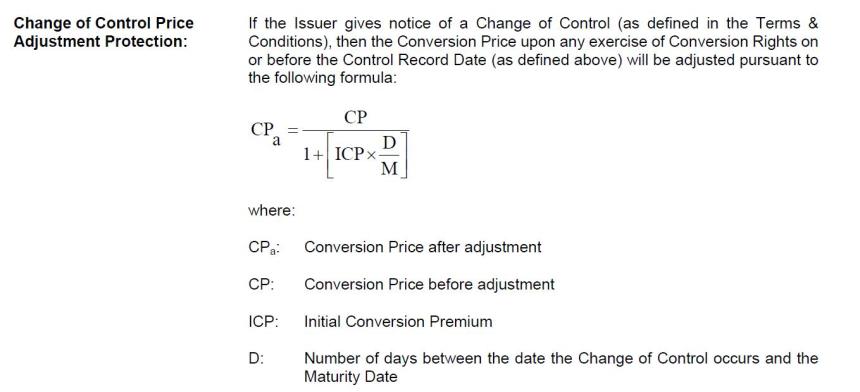
This means that holders of the bonds now get more shares than before.
The “new” conversion price now would be now approx. 18.99 EUR, and the amount of shares accordingly 5.266 per 100k nominal. This in turn, multiplied with a share price of 23 EUR would mean a fiar value of the convertible of 121k or 121%, pretty much exactly where it is trading now.

In total, the 2018 convertible will be exchangeable into 19 mn shares, more than 10% of total outstanding shares at any time after the take over happens. However, this could turn out to be a big problem for McK. Any company doing such a takeover wants to get rid of minorities as quickly as possible and is therefore trying hard to squeeze out shareholders and delist the company.
With the 2018 convertible, this could be very difficult. Even if McK owns more than 95% of the shares, convertible holders could suddenly convert bonds into shares and then make a squeeze out impossible. The 2018 convertible therefore has a quite high “annoyance factor” for McK. In general, when a company has a more complicated capital structure, an “annoying” security can be a very good security to own.
In the case of the convertible, the only possibility for MCK to get rid of the convertible early, is the so-called “soft call feature”. This enables the issuer to call the bond, if the stock price is at or above 130% of the initial conversion price of 22.48. This would mean a stock price of around 29,20 EUR or an implict bond price of 154%.
EDIT: The soft call in the complete prospectus refers to the “applicable” conversion price. So in our case, after a change of control, it would be ~19 EUR and the call level would be around 24.70 EUR. This reduces the upside potential of the convertible, but it might increase the chances of a better offer overall.
That those thoughts are not totally without merit could be indicated via the disclosure int he offer documents that they seem to be already buying busily convertibles with the focus on the 2018 bond:
McKesson International Holdings IV S.à r.l., eine mit der Bieterin gemeinsam handelnde Person, hält 105 Anleihen 2014, welche zum regulären Wandlungspreis Wandlungsrechte in 233.437 Celesio Aktien gewähren, was 0,137% der derzeit ausgegebenen Celesio Aktien entspricht, und zum angepassten Wandlungspreis infolge eines angenommenen Kontrollwechsels am 17. Januar 2014 Wandlungsrechte in 242.494 Celesio Aktien gewähren,
was 0,143% der derzeit ausgegebenen Celesio Aktien entspricht, sowie 139 Anleihen 2018, welche zum regulären Wandlungspreis Wandlungsrechte in 618.327 Celesio Aktien gewähren, was 0,364% der derzeit ausgegebenen Celesio Aktien entspricht, und zum angepassten Wandlungspreis infolge eines angenommenen Kontrollwechsels am 17. Januar 2014 Wandlungsrechte in 730.042 Celesio Aktien gewähren, was 0,429% der derzeit ausgegebenen
Celesio Aktien entspricht.
Swimming with the Sharks
Why did I call this “Swimming with the sharks” in the headline ? Well, this is clearly not a small unknown company. We have Goldman Sachs (advisor McK) and Elliott in the game, both very very clever financial market players which i would consider as “sharks”.

The true “decision” tree ogf the players involved clearly includes a lot more branches with some of them resulting in negative payouts for “innocent bystanders”. So there is always the possibility that one ends up as “prey” in such situations, so be careful and don’t bet the house on any outcome.
So to summarize this quickly:
1. The Celesio share looks like “good value” if one believes in a certain upside due to the Elliott involvement and no dirty deals on the side
2. The 2018 convertible looks like the even more interesting part. In order to get rid of this bond, MCK will have to offer ~30% more than the current price which I think is very likely even if the Elliott trade doesn’t work out
In order to play both “games”, I will allocate 1.25% each for the portfolio, the stock and the 2018 convertible at current prices (22.80 EUR, 121%).