Performance April 2013 & comment: “All time highs”
Performance April 2013:
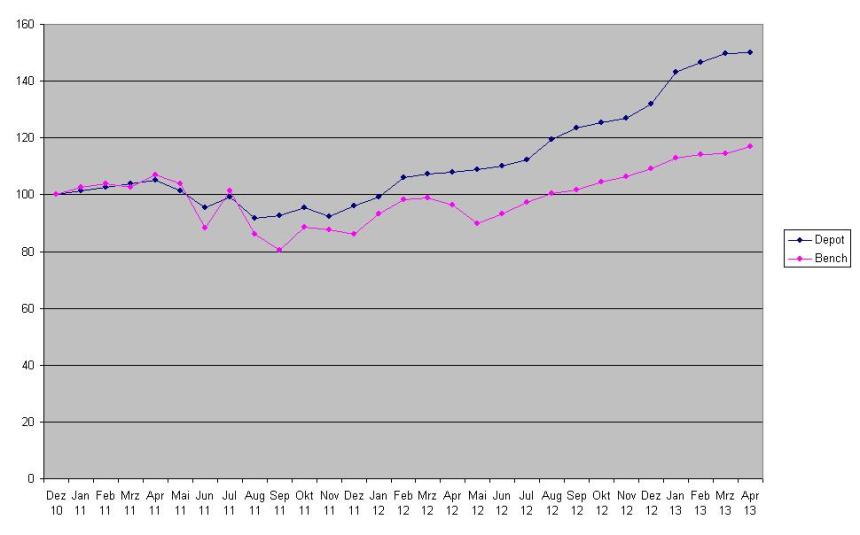
Performance for the month April was +0.5% against +2.1%, an underperformance of -1.6% vs. the Benchmark (50% Eurostoxx, 30% Dax, 20% Dax). YTD, the portfolio is up 14.0% against 4.9% for the Benchmark.
For some reason, the underperformance in April reassures me that my strategy is working. I would assume in “up months” a weaker performance than the benchmark, in down months a significant better relative performance. However, in the first 3 months of 2013, the portfolio strongly outperformed although we had seen 3 “up months” in a row and I ran at ~15% net cash in the portfolio. Despite the nice developement, one has to ask if there isn’t a lot of “hidden beta” in the portfolio.
However the current month shows that the stocks do have “their own life” versus the benchmark. For instance Tonnellerie, which acted like a high beta stock in the beginning of the year came down to earth with a -17,7% performance in April. As a reader asked me for it, here is the graphical performance since Inception:
Portfolio as of 30.04.2013:
| Name | Weight | Perf. Incl. Div |
|---|---|---|
| Hornbach Baumarkt | 3.8% | 2.8% |
| AS Creation Tapeten | 4.7% | 55.2% |
| Tonnellerie Frere Paris | 5.3% | 62.2% |
| Vetropack | 4.4% | 7.4% |
| Installux | 2.8% | 8.7% |
| Poujoulat | 0.9% | 6.4% |
| Dart Group | 4.1% | 124.0% |
| Cranswick | 5.4% | 26.6% |
| April SA | 3.3% | 4.2% |
| SOL Spa | 2.7% | 25.4% |
| Gronlandsbanken | 2.2% | 23.2% |
| G. Perrier | 3.0% | 4.8% |
| KAS Bank NV | 4.7% | 23.0% |
| BUZZI UNICEM SPA-RSP | 5.2% | 24.8% |
| SIAS | 5.4% | 48.6% |
| Bouygues | 2.6% | 10.2% |
| Drägerwerk Genüsse D | 10.1% | 193.0% |
| IVG Wandler | 4.1% | -17.7% |
| DEPFA LT2 2015 | 2.7% | 58.8% |
| HT1 Funding | 4.7% | 56.4% |
| EMAK SPA | 4.3% | 31.2% |
| Rhoen Klinikum | 2.2% | 8.4% |
| KPN shares | 0.6% | 0.2% |
| KPN rights | 0.4% | -1.0% |
| Short: Focus Media Group | -0.9% | -8.5% |
| Short: Prada | -1.0% | -13.7% |
| Short Kabel Deutschland | -1.0% | -5.0% |
| Short Lyxor Cac40 | -1.2% | -11.7% |
| Short Ishares FTSE MIB | -2.0% | -10.3% |
| Terminverkauf CHF EUR | 0.2% | 6.4% |
| Cash | 16.4% | |
| Value | 42.5% | |
| Opportunity | 47.0% | |
| Short+ Hedges | -5.9% | |
| Cash | 16.4% | |
| 100.0% |
Major changes were: Increase in Perrier to now 3%, sale of Total Produce and WMF pref shares, increase in IVG convertible plus 1% KPN as a new share. For my portfolio, this was a very active month.
Comment: All time highs
A lot of newspaper articles are concerned with the current “all time highs”, both in the DAX and the S&P 500 as well as the Dow Jones. Many people argue that level is of very high significance, either as an upper boundary or support.
In my opinion this is one of the most prominent cases of “Anchoring”, a well documented behavioural finance bias. Yes, the Dax already 2 times bounced back from the 8000 point level, in 2000 and 2007 as this chart clearly shows:
However if you look at the composition of the DAX in those years one can quickly see that the Dax is a very different animal now than in the past.
Those are the Top 5 stocks now:
| Weight | |
|---|---|
| BASF SE | 9.9% |
| Bayer AG | 9.8% |
| Siemens AG | 9.0% |
| SAP AG | 8.1% |
| Allianz SE | 7.6% |
Compare this to the top 5 a mere 5 years ago on December 2007:
| Weight | |
|---|---|
| E.ON SE | 10.1% |
| Siemens AG | 9.9% |
| Allianz SE | 8.4% |
| Daimler AG | 8.2% |
| BASF SE | 6.2% |
Yes, 3 stocks are still in the Top 5 (Allianz, BASF and Siemens) but 2 out of 5 are new and the weights are significantly different.
Even if we compare the top 5 based on their P/Es, we can see that even those shares which remained in the top 5 trade at quite different P/Es:
| PE 2007 | PE 2013 | |||
|---|---|---|---|---|
| E.ON SE | 15.6 | BASF SE | 14.6 | |
| Siemens AG | 26.3 | Bayer AG | 26.3 | |
| Allianz SE | 7.5 | Siemens AG | 14.1 | |
| Daimler AG | 23.3 | SAP AG | 25.4 | |
| BASF SE | 12.4 | Allianz SE | 10.4 |
So what does that mean ?
In my opinion, the current absolute level of the DAX compared to the past is totally irrelevant. Any investment decision on such an arbitrary basis is a clear “anchoring bias”. Investment decisions should be made irrespective of index levels. If you find a cheap stock buy it, when a stock is too expensive, sell it. It doesn’t matter where the Index is compared to its past.


