Category Archives: Bilanzanalyse

Piquadro SpA – Competitors, market analysis and strategies

Normally it is quite difficult for a private investor to get hold of comprehensive market information. One could try to google and try to collect some articles, but “hard data” is usually only available if you pay.

However, many listed companies include some market and competitor info in their analyst presentations. Piquadro provides us with a nice graphic of competitors in its 2011 April Analyst presentation:

Interestingly, in it’s own presentation one can see that the “Premium / Performance” segment is also the most crowded one.

An even better source for market data are IPO filings. In an IPO prospectus, companies usually provide a lot more information than in annual reports, as they have to persuade new investors that this is a exciting market.

Luckily, competitor Samsonite actually was IPOed last year on the Hongkong stock exhange after filing bancruptcy in 2009 (and also in 2002 if I remember correctly). The Samsonite story also shows the biggest risk for those companies: Overexpansion and too much lease liabilites, in this case driven by a Private Equity owner.

Tumi, currently owned by PE firm Doughty Hanson is currently on the path to an IPO and has already filed its documents for an IPO. To make things more interesting, Samsonite already anounced its interest purchasing TUMI.

So we have to additional sources for market information in this case.

For Mandarina Duck, the other major competitor from the Piquadro Matrix, currently no financial information is available. It seems to be owned by a PE shop as well.

Let’s start with the “Competitor” section of the TUMI IPO prospectus:

Competition

We have a variety of competitors in the categories and geographic regions in which we operate. We believe that all of our products are in similar positions with respect to the number of competitors they face and the level of competition within each product category. Depending on the product category involved, we compete on the basis of a combination of design, quality, function, price point, distribution and brand positioning.

Our biggest global competitor in the travel goods category is Rimowa, a German company. We also compete with Samsonite in Europe, the Middle East, Africa and Asia-Pacific. In the premium luggage and business cases category, we compete with Bally, Dunhill, Ferragamo, Gucci, Louis Vuitton, Montblanc, Porsche and Prada. In the business case category, we also compete with smaller brands in specific markets. In the U.S., our main competitors are Victorinox and Briggs and Riley. In Europe, the Middle East and Africa, our key competitors are Mandarina Duck and Piquadro. In the Asia-Pacific region, competition is fragmented. In Japan, our two key competitors are Porter and Ace Brand. We also compete with Coach across the luggage, business cases and accessories categories.

We believe that our primary competitive advantages are favorable consumer recognition of our brand amongst our targeted demographic, consumer loyalty, product development expertise and widespread presence in premium venues through our multi-channel distribution. We may face new competitors and increased competition from existing competitors as we expand into new markets and increase our presence in existing markets.

So again, we do not see any “hard” moats but rather some fuzzy brand recognition and customer loyalty aspects.

Even more interesting is the very detailed IPO prospectus of Samsonite. This is a “treasue trove” of interesting market data.

The “1 million dollar quote” however can be found at page 95:

Barriers to Entry and Benefits of Scale and Leadership in the Luggage Market
Barriers to entry into the luggage market are generally low, which has contributed to the fragmented nature of the industry. Key challenges for an entrant or an existing company are investment in brand awarness, innovation in new products, access to quality producers, and developement of an effective national / local retail network.

So here the “market leader” tells us there are no barriers to entry. So no “moats”. Period.

The Industry overview section of the filing is really interesting and comprehensive (p-90).

The market itself is supposed to grow at quite an attractive overall rate:
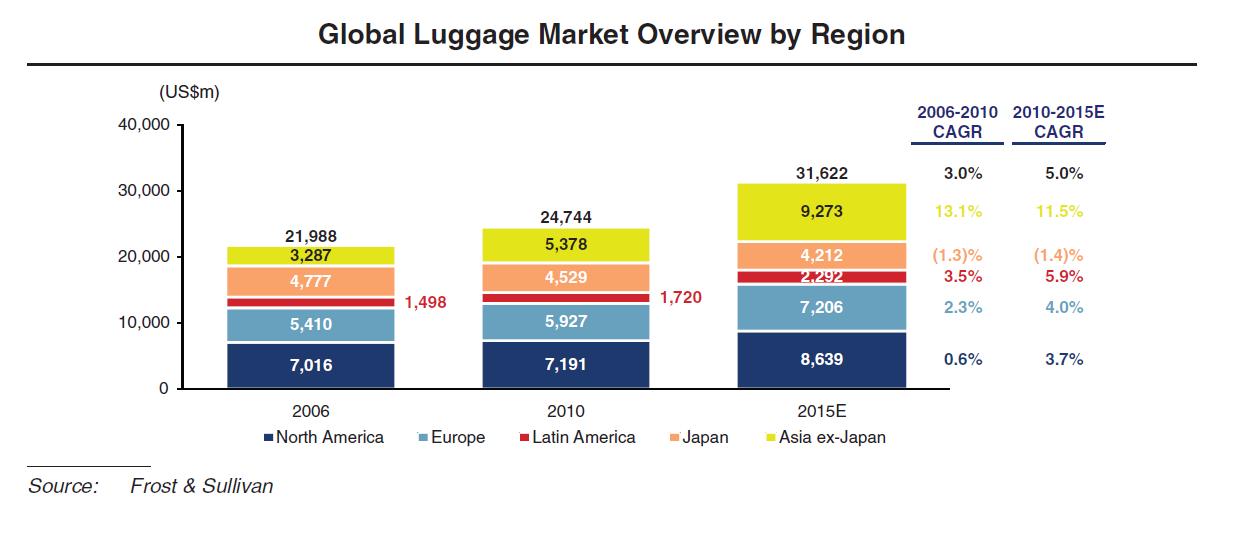
Samsonite itself does not yet realise Piquadro as competitor, neither Mandarina Duck. Piquadro and Mandarina Duck are only mentioned among others which are shown having a combined market share of 74.5%.

Howver, Samsonite places itself directly into the “Premium” category in contrast to Piquadro and Tumi themselves:
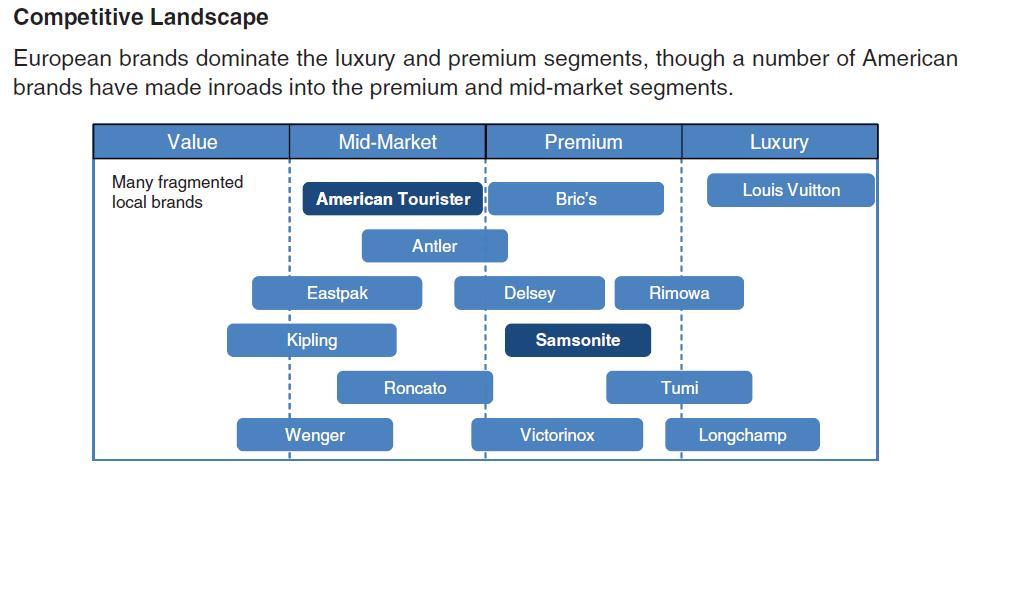
Side remark: Anyone who had the problem at an Airport baggage claim to find out which of the 25 identical black Samsonites is the own bag knows that this is more “mass market” than anything else.

The luggage market according to Samsonite can be segmented into 3 product segments:
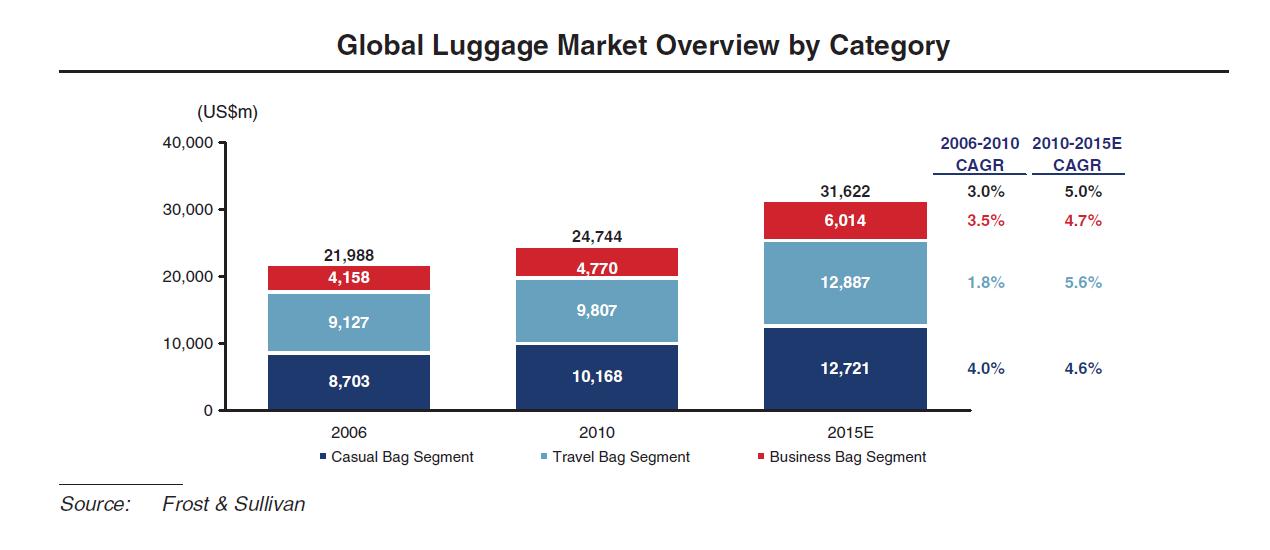
Samsonite also has an interesting “market share” slide for Europe which shows the high fragmentation:

So the big question is now: Should I stop now with analysing Piquadro because there is definitely no “objective” moat ? I would say, no, because for some reason, Piquadro has been able to grow, maintain high margins and produce free cashflow. When we continue to evaluate the company we should however incorporate a certain “normalisation” of returns anad margins.

Also the whole market segment seems to be quite attractive as even in “good old Europe” some nice growth is expected in the coming years as indicated before which can be incorporated int he valueation to a certain extent..

Strategy

Tumi has a very interesting passage in its IPO filing regarding marketing:

We do not employ traditional advertising channels, and if we fail to adequately market our brand through product introductions and other means of promotion, our business could be adversely affected.
In 2010, we spent approximately 3% of our net sales on advertising and promotion expenses. Our marketing strategy depends on our ability to promote our brand’s message by using store window campaigns, product placements in editorial sections, social media to promote new product introductions in a cost effective manner and the use of catalog mailings. We do not employ traditional advertising channels such as newspapers, magazines, billboards, television and radio. If our marketing efforts are not successful at attracting new consumers and increasing purchasing frequency by our existing consumers, there may be no cost-effective marketing channels available to us for the promotion of our brand. If we increase our spending on advertising, or initiate spending on traditional advertising, our expenses will rise, and our advertising efforts may not be successful. In addition, if we are unable to successfully and cost-effectively employ advertising channels to promote our brand to new consumers and new markets, our growth strategy may be adversely affected.

Interestingly, the “Market leader” Samsonite spent almost 9% of revenues on marketing in 2010(see IPO fact sheet), Piquadro around 5%.

Samsonite focuses basically to almost 100% on the wholesale sales channel, Tumi has reached a 50/50 split between wholesale and single brand stores.

Very interisting is the fact, that Piquadro just hired a seasoned TUMI executive for international brand expansion.

Peer Group comparison

Let’s just make a quick comparison with regard to profitability. As one could expect for PE owned companies, both TUMI and Samsonite show quite a messy capital structure and “real profits” don’t really exist. So let’s work with what they call “adjusted” EBITDA (Samsonite & Tumi in USD, Pqiadro in EUR):

Samsonite TUMI Piquadro
Sales 1,215.0 252.8 61.8
Total assets 1,665.0 321.0 29.6
NWC 372.0 80.2 16.1
EBITDA adj 191.9 40.6 16.4
       
EBITDA/Sales 15.8% 16.1% 26.5%
EBITDA/Assets 11.5% 12.6% 55.4%
NWC/Sales 30.6% 31.7% 26.1%

This is really interesting. Piquadro is the most efficient and most profitable company of this “Peer group” based on “simple” metrics.

Summary: A quick view into the market and competitors show the following:
– the market is quite fragmented, no real barriers to entry exist and therefore no “classical” moats
– nevertheless all companies seem to be able to generate at least currently some decent returns on assets
– Picadro itself seems to be the most efficient of the 3 companies. It is therefore likely that no strong “economies of scale” exist in this market

I will follow up with a valuation approach in the next days.

Core Value WMF AG – Hidden “Mittelstand” Champion – Part 1

WMF AG is one of the “core value” stocks, I have only mentioned briefly. WMF was founded over 150 years ago (wikipedia). The company is well known for generations in Germany for producing excellent kitchen supplements, especially cooking pots and pans, cuttlery and other “kitchen helpers”. Additionally they started at some time in the sixties to produce coffee makers, especially for the professional area like restaurant, company cafeterias etc.
Read more

Esso S.A.F. – less attractive at a second glance

After having quickly analysed “Magix Six” stock Esso S.A.F a few days ago with some encouraging results, I dived a little bit into the company.

Despite beeing a subsidiary of ExxonMobil, the homepage is “french only”.

Luckily, I managed to understand at least the two investor presentations they have on their website.

Both, the 2011 and the 2010 show a quite depressing picture.

Read more

IVG capital increase

IVG is an interesting example for a “distressed” company, where the position as Senior bondholder is much more comfortable than being a shareholder.

After announcing relatively good Q3 numbers on which I commented earlier this month, they announced today the following:

The management board of IVG Immobilien AG, Bonn (ISIN DE0006205701) has, with the consent of the supervisory board, resolved to increase the registered share capital of the company from € 138,599,999 by € 69,283,885 by issuing 69,283,885 new ordinary bearer shares.

The new shares will be offered to existing shareholders by means of indirect subscription rights at a subscription ratio of 2:1, meaning that two existing shares will entitle a shareholder to subscribe for one new share. The subscription price is € 2.10.

A lot of people bought IVG shares because they trade well below book value, howver, issuing such a huge amount of new shares at an ever larger discount to book value is a clear dilution for existing shareholders. The result was a 15% drop in the shareprice.

For the 2014/2017 Convertible bond, this is in contrast good news which shows in a steadily increasing bond price:

From my point of view, there are a few take aways from this situation:

– looking at price to book ratios for distressed companies should always include the possibility of massive dilution
– especially when banks are involved who can use loan covenants as a tool the force capital increases, shareholders will normally suffer
– in such cases buying senior bonds at a large discount looks like a much better position compared to stocks
– stock or subordinated debt of distressed companies will only become intersting, once liabilites are reorganized in a way that no refunding is necessary for an extended amount of time (e.g. through long term bond issuance)

In my opnion, we will see more or less similar actions for Praktiker.

Praktiker – Restrukturierungsplan

Ich hatte in den vergangenen Monaten ja diverse Posts zu Praktiker gschrieben mit dem Resultat, dass aufgrund der hohen Verschuldung und der Mietverbindlichkeiten kein “Margin of Safety” erkennbar war.

Insbesondere die Cashflow Problematik hat die Handlungsfähigkeit der Firma extrem eingeschränkt.

Mein Votum nach den Halbjahreszahlen war:

Zwischenfazit: Insgesamt darf man also mit weiteren „Sondereffekten“ rechnen, sollte ein neuer CEO mal anfangen aufzuräumen und unprofitable Standorte zu schliessen. Auch die Marge dürfte unter dem Lagerverkauf und den dazu notwendigen Sonderaktionen im 3ten Quartal deutlich leiden.

Jetzt ist der neue Chef Thomas Fox mit seinem Sanierungsprogramm an die Öffentlichkeit gegangen. Da ich kein Sanierungsexperte bin, kann ich relativ wenig zum Inhalt sagen,aber generell macht es sicher Sinn, nur eine Zentrale zu haben und unprofitable Standorte zu schliessen.

Interessant ist diese Aussage aus einem FTD Artikel:

Konkret will er in den kommenden Wochen mit Arbeitnehmern, Vermietern und den Kapitalgebern, die eine Praktiker-Anleihe gezeichnet haben, über einen Verzicht verhandeln. Die Höhe des Verzichts wollte er nicht benennen. “Ich habe für jede Gruppe sehr genaue Vorstellungen”, sagte er dazu lediglich. Einigen Vermietern drohte er außerdem mit dauerhaften Einschnitten oder Kündigungen, weil ihre Mieten überhöht seien.

Das ist doch sehr interessant. Ich bin zwar kein Distressed Debt Spezialist, aber solange Praktiker keine Insolvenz anmeldet gibt es keinen Grund für Anleihegläubiger auch nur einen Cent nachzulassen. Insbesondere da die Anleihe ja die durchaus werthaltige “Change of Control” Poison Pill besitzt.

Praktiker will ja 300 Mio investieren, die Aussagen im Conference Call zur Finanzierung waren sehr vage.

Ohne eine klare Vorstellung der Refinanzierung ist meines Erachtens auch die Anleihe nach wie vor “uninvestierbar”. M.E.ist auf jeden Fall eine massive Kapitalerhöhung unvermeidbar, wahrscheinlich dazu noch eine Wandelanleihe o.ä.Auf jedne Fallwerden die Aktionäre nch weiter verwässert werden, insofern ist der Kursrückgang der durchaus gerechtfertigt.

Interessant ist die Tatsache, dass nach der Veröffentlichung des Plans der Kurs zuerst gestiegen ist, um dann nach dem Call wieder stark zu fallen.

Das ist aber m.E. kein Wunder, der CFO macht meines Erachtens keine gute Figur und fasselt nur allgemein daher,man hat nicht das Gefühl dass man das Thema Finanzierung wirklich im Griff hat.

Merke: nicht nur Berichte lesen sondern auch die Calls anhören.

Fazit: Die Aktie ist m.E. nach wie vor für Valueinvestoren nicht investierbar, es dürfte noch eine signifikante Verwässerung durch Kapitalerhöhung bevor stehen. Die Anleihe selbst könnte bei einem wirklich geringen Preis (unter 50%) interessant sein werden.

UPM Kymmene Part 2: Earnings Power Value (EPV)

After the replacement value analysis for UPM in part 1, let’s move to an EV analysis based on free cash flows:

Interestingly, UPM’s standard cashflow reporting makes life relatively easy for my free cashflow analysis.

I will start with a rather big table and then explain

Starting with the operating Cashflow as stated, one can quickly see that working capital is relatively volatile, however over 7 years the effect was more or less neutral.

Next, the capex line is really interesting (Capex ex M&A and sale of assets). We can clearly see that UPM drastically reduced capex from 2009 on. UPM’ paper mills seem to be relatively new and don’t require a lot of maintenance cost in the foreseeable future.

Also interesting is the fact that although UPM is still relatively “asset rich” and despite having invested more than 500 mn EUR into the Uruguyan pulp mill in 2008, over the last 7 years ~ 1.8 bn EUR of net assets have been sold.

So in total, UPM generated ~ 4.9 bn cash, thereof 3.1 bn free Cash flow plus 1.8 bn assset sales over the last seven years. More than half of this has been used to pay dividends and buy back stock, the rest has been used to pay down net debt.

This corresponds nicely ith the communicated goals of the company:

UPM intends to pay as an annual dividend at least one third of net cash flow from operating activities less operational capital expenditure. To promote stability in dividends, net cash flow will be calculated as an average over a three-year period.
Remaining funds are to be allocated between growth capital expenditure and debt reduction. The net cash flow from operating activities for 2010 was EUR 982 million and operational capital expenditure EUR 186 million.

So how does this translate into EPV ? Based on the 7 year average free cashflow of 0.92 EUR and a standard discount rate of 10%, this would only result in an EPV of 9,2 EUR or roughly 10% undervaluation.

Now the big question is: are those 7 years really “average” years or has something changed? In particular it is crucial to understand if capex will go up again in the future or remain at the current low level.

A quick glance into the Q3 report shows that “normal” capex has remained at a relatively low level, at a run rate of around 300 mn EUR for 2011.

If we assume this as a representative Capex going forward, UPM could deliver under a “no growth” scenario around 1 bn of operating cash minus 300 mn for Capex which would result in a recurring free cash flow of 700 mn EUR or ~ 1.35 EUR per share p.a., which would give us an EPV of around 13.5 EUR, relatively close to the Replacement Value of 14.26 EUR.

So summarizing this I would state the following:

– UPM seems to have greatly reduced Capex over the last 2 years
– if those reductions are to a large extent permanent, a “fair” EPV could be around 13.5 EUR per share (no growth), if not, the stock would be only slightly undervalued
– management clearly communicates and delivers on the use of free cash flow (very positive in my opinion)

In the upcoming final post for UPM I will focus on the qualitative aspects and the business itself

UPM Kymmene – Relacement Value analysis

Based on the positive results from the “quick check”, I will follow up with the first step of my standard analysis process, the so called “Replacement Value” analysis.

As a starting point, I will use the Net Equity position from the 2010 Annual report of UPM.

Then as a standard I would normally subtract the following entries from the Net Equity:

– minority interests (small, only -16 mn EUR)
– Goodwill (-1.022)

However, if we look at the goodwill breakdown in the annual report, we see the following:

Goodwill by reporting segment
As at 31 December
EURm 2010 2009
Pulp 202 197
Forest and Timber 1 1
Paper 799 799
Label 7 7
Plywood 13 13
Total 1,022 1,017

If we look at the segment numbers of the pulp business on page 90 of the report, we can easily see that the pulp business (basically the pulp mill acquired in Urugay in 2007) was extremely profitable in 2010, providing a significant share of UPM’s profit. So in this case I would consider the goodwill of the acquisition not as worthless, but include it into the replacement value. (remark: It looks like that the investment into the Uruguayan pulp mill was really perfectly timed, UPM got back most of its investment already after one year !!!)

Next in line are the “other intangible assets”, worth 424 mn EUR. The largest portion of this position are “intangible rights”, with ” water rights” (189 mn EUR) having the largest share.

These water rights are explained as follows:

Intangible rights include EUR 189 million (189 million) in respect of the water rights of hydropower plants belonging to the Energy segment. The water rights of power plants are deemed to have an indefinite useful life as the company has a contractual right to exploit water resources in the energy production of power plants. The values of water rights are tested annually for impairment based on expected future cash flows of each separate hydropower plant.

Any other company which would like to start a similar Hydro Power project would have to buy those rights as well, so we can assume that this part of the “Intangible Assets” has value. The rest of the intangibles seem to be software licences and carbon rights, so in the absence of fancy stuff I would not make any further deductions.

This results in the following adjusted value for equity after minorities, Goodwill and intangibles:

FY 2010 mn EUR per share
Equity 7,109 13.67
-minorities -16 -0.03
-goodwill -1,022 -1.97
+ goodwill pulp 202 0.39
-intangibles 0 0.00
adj. Equity 6,273 12.06

Next are “special” balance sheet items such as pensions, land and buildings etc.

Pensions:UPM has 424 mn EUR pension liabilities on-balance sheet. According to the notes, the total pension liabilities including funded schemes are around 1 bn EUR.

The underlying assumptions (~ 4.4% discount rates, 6.5% assumed yield on plan assets) seem to be OK, however the large percentage of stocks in the pension funds (60%) results in a certain risk to the sponsor of those plans. So as a conservative approach, I will deduct 100 mn EUR (or 10% of gross pension liabilities) from UPM’s net equity as “buffer” for pension plan asset risk.

Buildings:
Other than for example a REIT, a company like UPM which owns most of their buildings outright has to write them down to zero over the term of their “economical life”. As everyone knows this appoach is quite conservative, as even 25 or 40 year old building keep some of their value if they are properly maintained.

If one looks at private equity buyouts, own real estate is often one of the “quick wins” for LBO investors if they sell and lease back the written down real estate at a large profit.

So as a rule of thumb I usually add back 50% of the cumulative depriciation on buildings. UPM has 1.505 mn EUR of buildings on its balance sheet, with an original cost of 3.207 mn EUR. So 50% of 1.702 mn EUR is 851 mn EUR which I add back to the equity value of UPM.

Biological Assets:
As UPM owns ~ 1 mn hectares of timber land, we see ~ 1.4 bn of biological assets. As the discount rates (7.5% for Finland, 10% for Urugay) seem to look OK, I don’t adjust this position. However this is something worth to be monitored closely.

“Extra Assets”:

UPM shows 573 mn of investments in “associated” companies. The largest by far with around 540 mn EUR is the participation of 43% in a company named “Pohjolan Voima Oy, FI”.

The homepage of the company states the following:

Pohjolan Voima produces energy at cost for its owners and manages the entire lifespan of power plants reliably, cost-effectively and in an environmentally friendly manner.

In another section of the homepage, the business model is explained as follows:

Pohjolan Voima supplies electricity and heat to its shareholders at cost, and the shareholders cover the costs of the operations – this operating model is also called the “Mankala principle”. The name is derived from a ruling issued by the Supreme Administrative Court in the 1960s, constituting a precedent. In this ruling, the shareholders of a company called Oy Mankala Ab were found not to have received taxable income when Mankala generated and supplied them with electricity at a price lower than the market price and the shareholders covered the company’s costs on the basis of its Articles of Association.

So this is really interesting. UPM carries the participation “at Equity”, but what would be a fair price ? Any new competitor would have to purchase electricity at market prices. One easy answer would be to look at Fortum. The big Finish utility with approx. the same mix of energy assets (nuclear/hydro) trades around 1.8 times book value. If we apply a more conservative multiple of 1.5 book value, we should add 270 nn EUR to UPM’s replacement value in order to reflect the value of the Pohjolan Voima participation.

R&D + Marketing / Branding

Last but not least we have to look at R&D and marketing expenses, if there is some “hidden” replacement value in the form of brand value or “off balance know how”. For acompanylike UPM,the value of the brand is moreor less neglectible, however we can attach some value to R&D.

UPM spends 40-50 mn EUR peryear on R&D. If we use as a rule of thumb 50% of the R&D expenses of the last 5 years as additional “replacement value”, we should add (5x45x0.5) = 112.5 mn to UPM’s replacment value.

So bringing all this together we get the folowing replacemnt value for UPM:

FY 2010 mn EUR per share
Equity 7,109 13.67
-minorities -16 -0.03
-goodwill -1,022 -1.97
+ goodwill pulp 202 0.39
-intangibles 0 0.00
adj. Equity 6,273 12.06
-pensions -100 -0.19
+ real estate 851 1.64
+ at Equ.part 270 0.52
+ R&D 122 0.23
Repl.Value 7,416 14.26

Summary: UPM is a very asset rich company. A relatively conservative approach results in an replacement value of ~ 14.26 EUR per share, mostly the result of undervalued real estate and at-equity participations. This alone would be an interesting investment case, as based on a current share price of 8,25 EUR, this equals a discount of 42% to replacement value or an upside of 72%.

In the following days I will take a closer look at free cash flows and “Earnings Power Value”.

« Older Entries Recent Entries »